
Malcolm Morgan explains recent updates to the Place-Based Carbon Calculator which help to identify the households most in need of support in the energy crisis.
The UK is facing a cost-of-living crisis, particularly from rapidly rising energy prices. There is an ongoing debate about the best way to address this crisis, but most people agree that it is essential to target any help to the people that need it the most.
This can be hard for policymakers to do effectively, especially as this crisis affects middle earners and low-income households already in the benefits system. However, most households will need help this winter. Ideally, policymakers would be able to target help based on people’s needs, and that help would be proportional to both the households’ income and energy demand. It would also be helpful if policymakers could identify the type of help required. For example, would £300 of loft insulation reduce heating bills by more than £300 in cash? In the long run, insulation will likely be the better choice, but people need help now, and we can only do so many retrofits per day, so the trade-offs are not simple.
It is not just the Treasury thinking about whom to help and how much. Local authorities, charities, and community groups will all be needed to get us through the coming winter. They will want to know where help is needed and what to provide. While the news is already awash with energy-saving tips it is all very generic because it is being distributed through mass media. However, every house and every household is unique, and people’s energy needs are complex.
So I’ve been thinking about what I could do to put better information into the hands of policymakers and the public. The Place-Based Carbon Calculator (PBCC) has already successfully communicated locally relevant data. Still, for the immediate crisis, it is not ideal. The data is from 2018, and the spatial scale is too large to identify struggling households. Therefore, I decided to see how far I could push the PBCC’s technology by adding the most up-to-date and localised data possible. From today, we have added two new datasets to the PBCC.
Postcode level domestic gas and electricity consumption (England, Scotland, & Wales)
The PBCC already has local gas and electricity consumption data as part of the Lower Super Output Area (LSOA) carbon footprints. LSOAs are small statistical areas with a population of about 1,500 – 3,000. However, the Government also publishes experimental statistics giving the energy consumption for each postcode. Postcodes are usually far smaller than LSOAs, covering only a handful of homes compared to LSOAs, which typically cover several hundred homes. The postcode-level data comes with caveats, so it should be treated with care. Nevertheless, in most places, it increases the level of detail and makes it easier to see where the high-energy-consuming homes are. The data also covers Scotland and Wales, taking the PBCC outside England for the first time.

Unfortunately, data is not published for every postcode. The Department for Business, Energy and Industrial Strategy (BEIS) have removed the data for any postcode where they think publication would be disclosive (e.g. a postcode with less than five homes). This applies to each of the three types of metre (gas, electric standard, electric economy 7). In these cases, they aggregate the data up to the post code. For example, if NR11 3DZ were disclosive, it would be aggregated with all the other postcodes starting with NR11. Unfortunately the aggregation is different for each type of meter which makes mapping them impossible. In many areas, the number of gas and electric metres do not match and this may be due to a mix of gas-grid properties or electricity meters removed for privacy. Overall, this created a mixed dataset that is very good in some places and quite poor in others. Such is the nature of experimental statistics. However, I think it is a worthwhile addition to the PBCC, as most UK households will have access to better, more localised data.
As well as the map, each postcode can be clicked on to see the total, median, and mean energy consumption, and I’ve also added estimates of the average energy bills based on the current and future energy price cap.
Energy Performance Certificates (England & Wales)
Since 2007, every home sold or rented in the UK has to have an Energy Performance Certificate (EPC). You may already be familiar with the A-G rating of your own home. While the EPC register was closed for many years, the England and Wales register was published a few years ago, and we included some of the EPC data in the PBCC. Since the launch of the PBCC, the Department for Levelling Up, Housing, and Communities have updated the data by adding the Unique Property Reference Number (UPRN) for each home. This means, for the first time, we can map the exact location of an EPC certificate and provide information on individual houses.
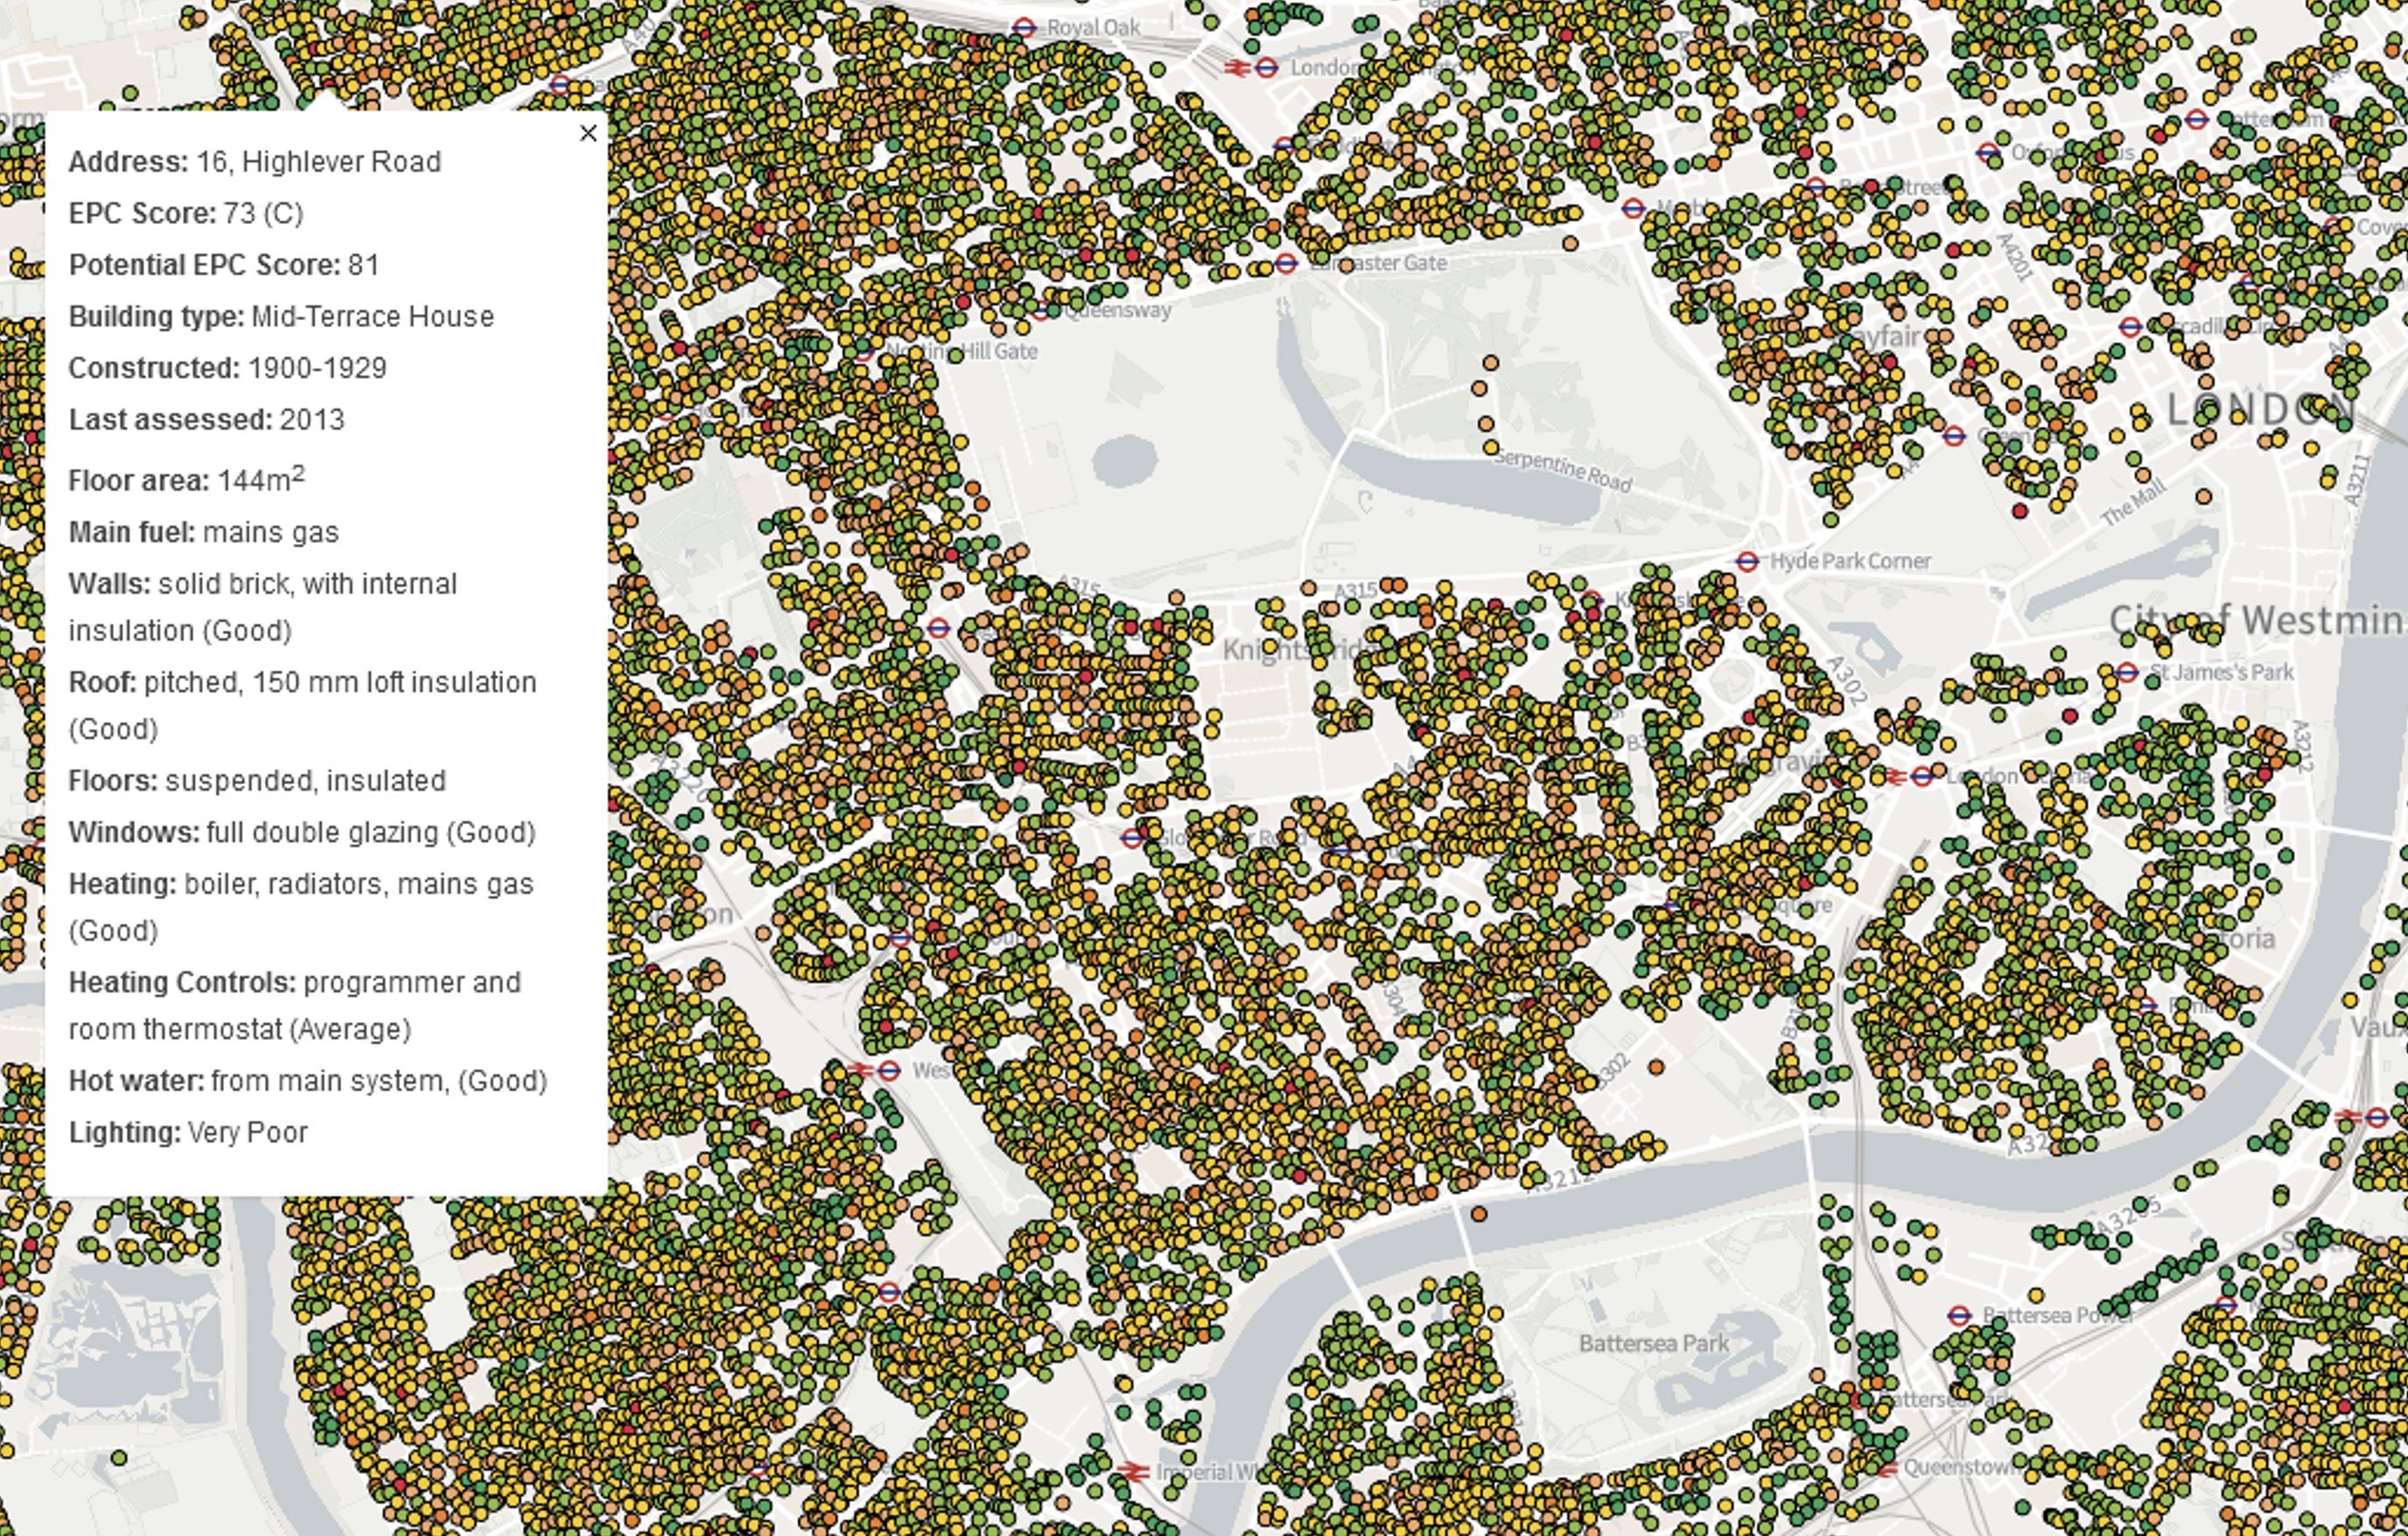
As well as the headline rating, the EPC certificate provides detailed technical details about the construction of the house and the heating system. This is potentially powerful information for identifying the low-hanging fruit of retrofit. Of course, care still needs to be taken with the EPC data. EPC certificates are prone to errors and are valid for ten years, so the data may be outdated.
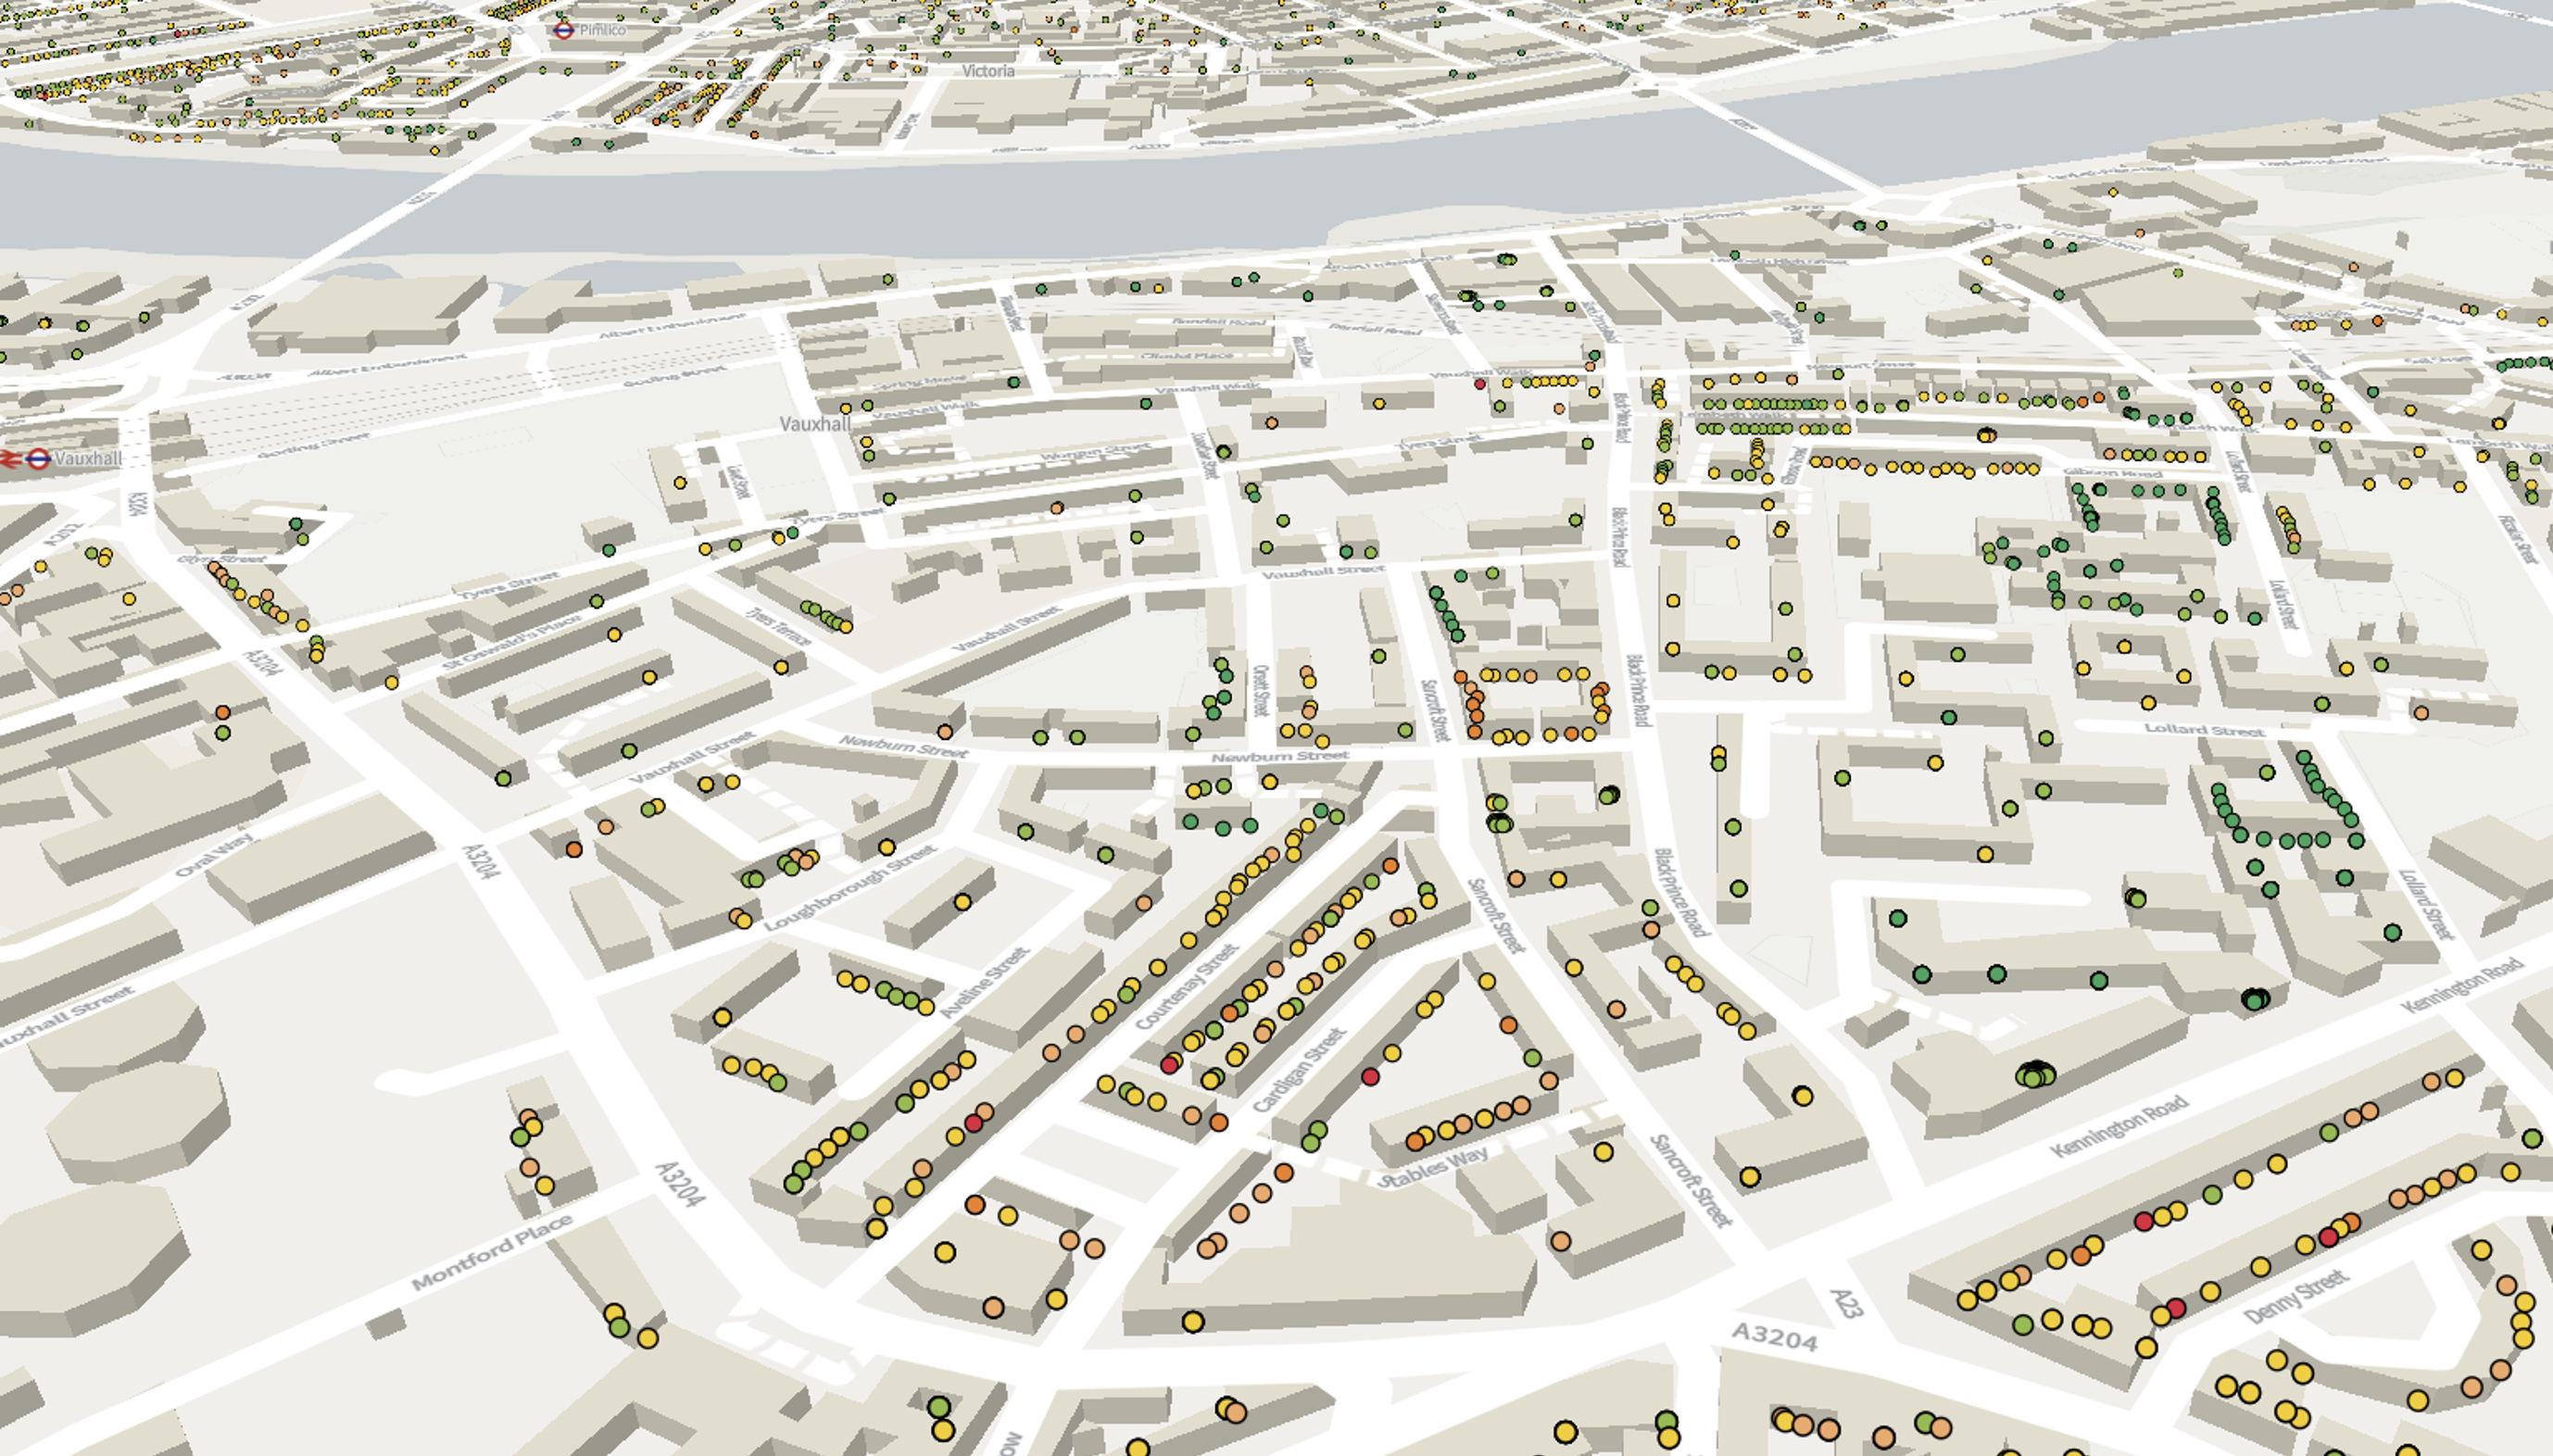
Updated base maps
I have also updated the base maps to facilitate the new data layers. This update allows you to zoom in much closer than previously possible and adds individual buildings to the map with a nice 3D effect which works especially well with the EPC data. The base map also gains hill shading to give a clearer sense of the terrain and in a future update will add fully 3D terrain.
Over to you
Mapping these two datasets will not solve the energy crisis, but I hope it will spark discussions around the kitchen and cabinet tables about why energy use/bills are so high in some areas and what can be done to reduce them. I’m sure people will come up with all sorts of inventive ways to use this information. I fear we are all in for challenging times, and if these maps help anybody to reduce their bills, it will have been worth the effort. But if you’re struggling with the cost of energy, here are a few of the tips I will be using this winter:
- If your energy consumption is above average for your street, think about how your home might differ from others – your house might be twice the size. Nonetheless, starting a conversation about this topic with your neighbours might give you ideas on how to save energy.
- Check your EPC data on the PBCC and see the additional information on the EPC register. Your EPC usually contains some recommendations on how to save energy. Are there any quick wins, such as loft insulation, that you could do? The cheapest retrofit measures are likely to pay back quickly now that energy bills are so high. In some places, there is financial support for retrofit measures.
- Read George Bennett’s blog series on how poorly optimised heating systems waste energy. Learn how to adjust the flow temperature of your boiler and bleed and balance your radiators. These are low-cost ways to get more heat for less money.
- Read Money Saving Expert’s heat the human, not the home guide, which has good advice on energy saving and maintaining your physical and mental health.
- Draught proofing is a low-cost way to save energy but requires some detective work. You can often feel these with your hands, but an incense stick is also helpful as the smoke trail can reveal where the air is flowing. Be careful not to set the furniture on fire as you hunt for draughts! Focus on the joints between floors, walls, ceilings, and around windows and doors, as these are the most common locations for draughts. You might be surprised by what you find. When I did this, I found a hole in the floor under the kitchen units so big I could put my arm through it. A bit of expanding foam, draught proofing strips, or even a rolled-up towel can make a big difference to a draughty room. However, make sure you do not seal up purpose vents – if you have open fires or unvented combustible appliances you must have an appropriate vent.
- Check if extractor fans in the kitchen and bathroom have backdraft valves. These only cost a few pounds and can be installed with moderate DIY skills.
- Most water companies provide free water-saving devices such as low-flow shower heads. Reducing your hot water consumption saves money on both water and energy bills. Not all the devices are suitable for every shower so check before you order.
Banner photo credit: Alex Geerts on Unsplash