A new data visualisation tool provides user-friendly ways to explore how everyday activities impact energy demand.
CREDS researchers have created an online portal, Energy demand flexibility and the rhythms of everyday life, where the links between people’s everyday lives, energy demand and its flexibility can be explored.
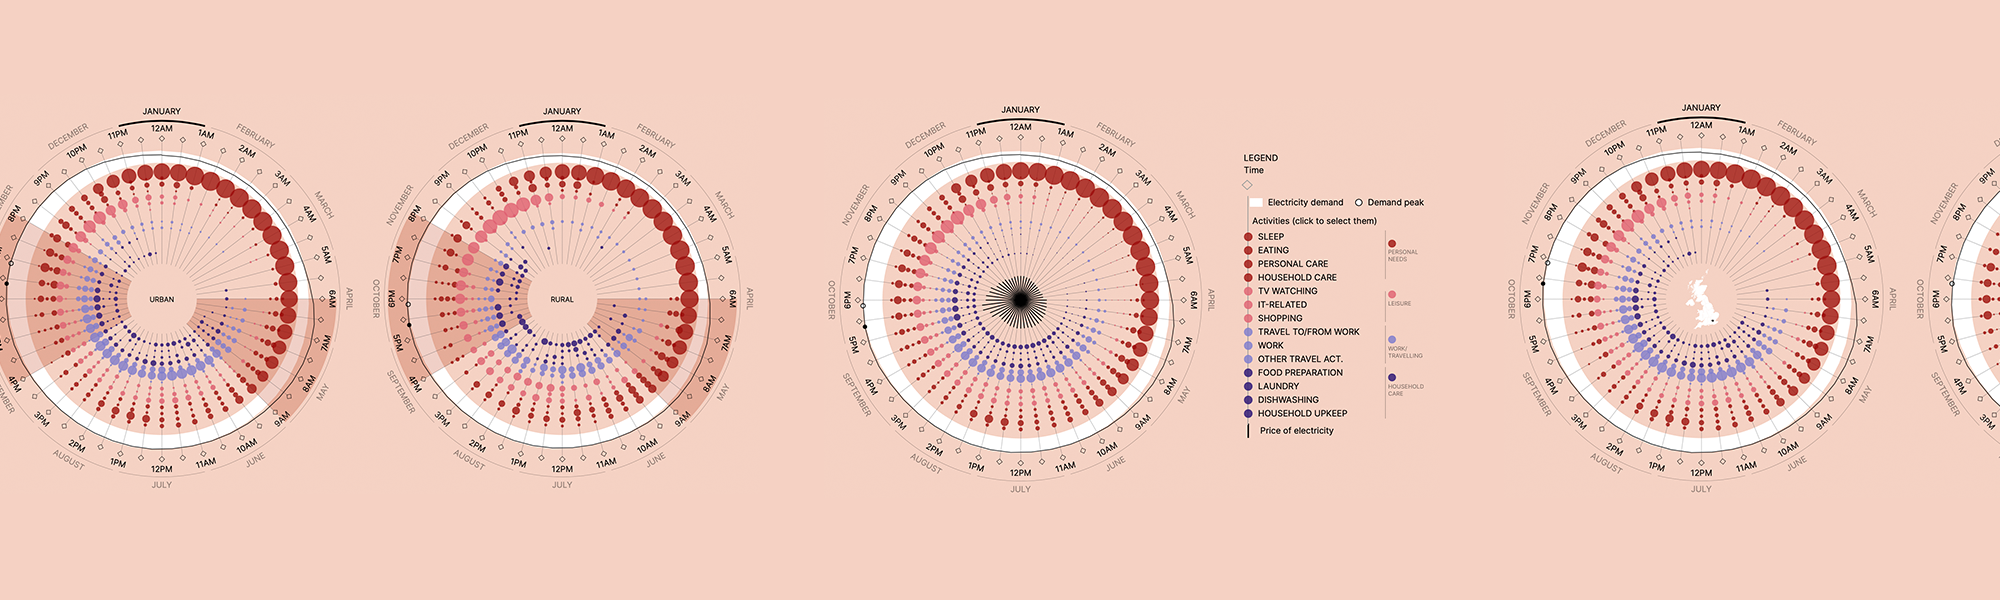
The tool provides accessible, user-friendly visualisations that show the ways in which everyday activities impact energy demand. Energy demand is the term used to describe the consumption, or use of, energy by human activity.
The team of researchers at Reading University condensed a wealth of data from a variety of sources into stand-alone visualisations that allow users to explore how everyday lives unfold over the course of a day, and what impacts they have on energy demand. Sleeping, eating, traveling to and from work, work itself have different rhythms which the researchers have observed. From this they were able to map where the peaks in energy demand are. Importantly, the visuals show the opportunities for shifting those energy-intensive activities away from busy periods of the day and into periods where there is potential to be more flexible, thus reducing the strain on the power systems.
Jose Luis Ramirez-Mendiola who led the development of the tool, said:
“We visualise everyday life as happening inside a 24-hour clock because we want to place what people do at the centre of our understanding of energy demand. At the heart of this approach is the position that the timing of energy demand is determined by the way people’s activities are ordered in time. Essentially, if we want to change energy demand, we need to change what people do and/or when they do it.”
“This type of visualisation is a conscious effort to visualise those underlying regular patterns that relate to the broader time constraints imposed by our social conventions (for example, the 9-to-5 work day). The visualisations show regular trends in everyday life through the simultaneous representation of the temporal rhythm of people’s activities and their shaping influence over households’ energy demand throughout the day, the year, and across regions.”
One of the challenges for a net-zero future is making the most out of our clean energy sources. This requires us to have the ability to shift our electricity demands to those times of day when clean power is plentiful – this is what we call flexibility. This new tool is an effective way of understanding how everyday life impacts energy demand and how flexibility can be enhanced.
Banner photo credit: Flexibility data from visualisation tool