
Philip Steadman, Stephen Evans, Rob Liddiard, Daniel Godoy-Shimizu, Paul Ruyssevelt and Dominic Humphrey
Abstract
A brief history is provided of models of energy use in the UK building stock, with the focus on the non-domestic sector. This history leads to an account of the development, since 2009, of the 3DStock method for modelling complete building stocks, both domestic and non-domestic. The paper explains how 3DStock models are built and the data sources used. Special emphasis is placed on the relationship of premises (the floorspace occupied by organisations) to buildings. Energy use may be metered at the level of premises, buildings or groups of buildings. Representing the patterns in which premises relate to buildings is therefore crucial to the modelling process, and in particular to the precise measurement of energy intensities. Applications of 3DStock models in building science and policy tools are reviewed, including the London Building Stock Model (LBSM), delivered to the Greater London Authority (GLA) in 2020. This ‘digital twin’ can be used for the monitoring, simulation and analysis of the building stock. Implications for research and policy are discussed, particularly for energy epidemiology, density, high-rise buildings, retrofit potential, energy-use intensity and benchmarking. Data are in place to extend 3DStock modelling to the whole of England and Wales.
Policy and practice relevance
The models can be used to assess energy demand in large numbers of buildings in relation to a range of variables, including built form, age, construction and activities. Poorly performing buildings can be identified, and the potential for retrofit—including renewable technology installations—evaluated using the same variables plus information contained in Energy Performance Certificates (EPCs). Policies for addressing fuel poverty can be evaluated by making links to confidential socioeconomic data on occupants. In conjunction with a dynamic building energy-simulation tool, scenarios can be investigated for retrofit, the potential for renewables and issues in demand-side management. Additional uses are in the precise measurements of density and of the three-dimensional character of the urban fabric. There could be applications in public health, the modelling of indoor and outdoor air pollution, and the tracking of material flows. 3DStock models might also be integrated with digital twins of infrastructure systems and networks.
1. General features of the 3DStock modelling system
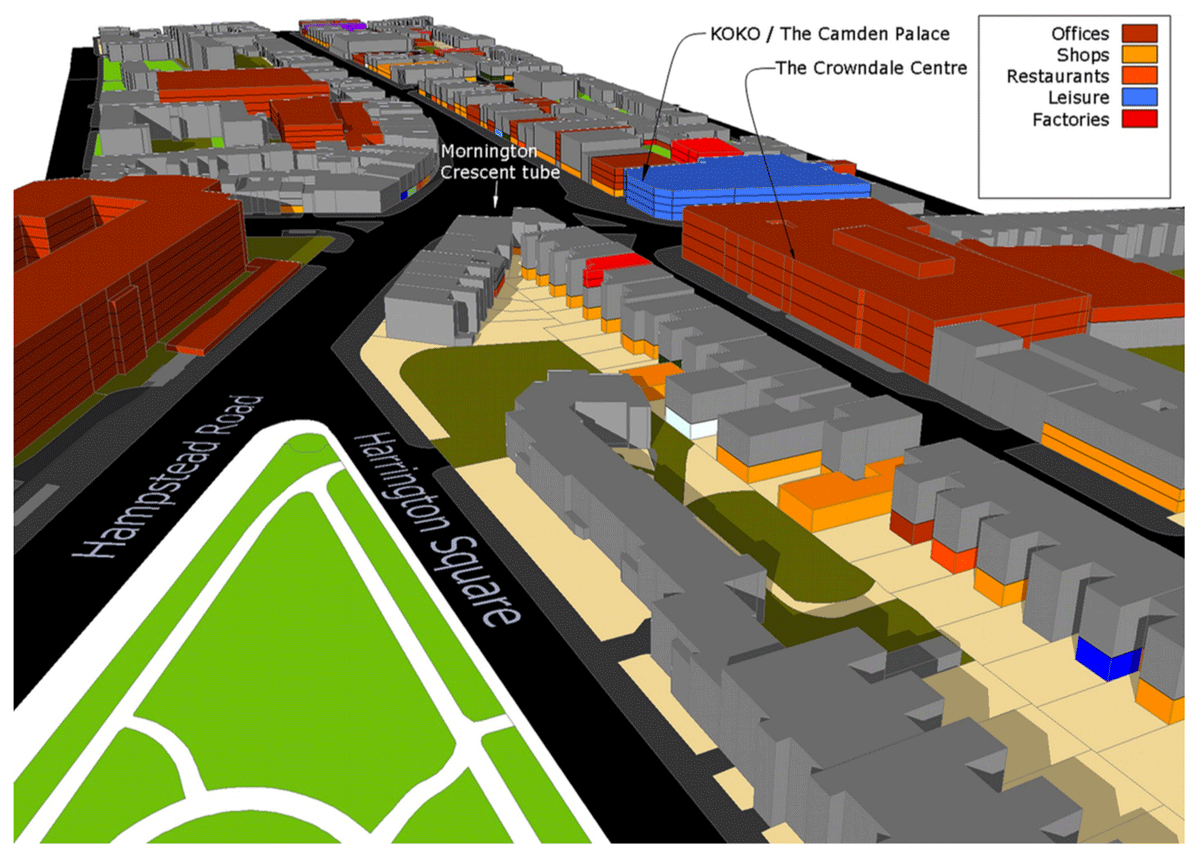
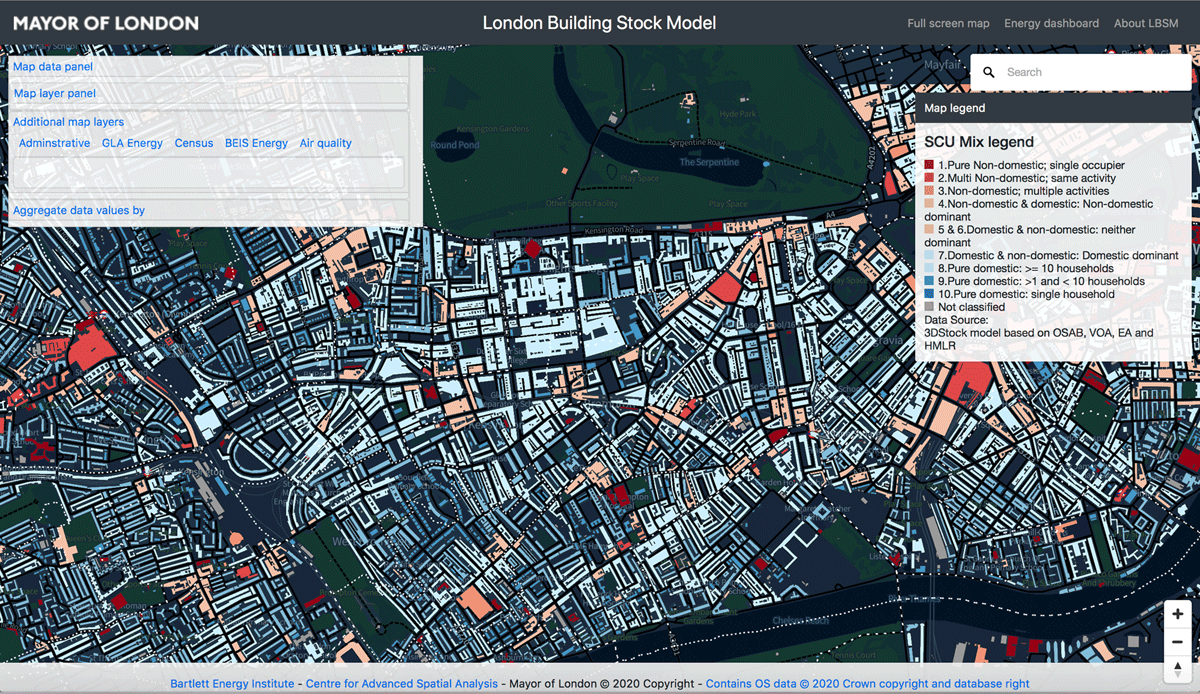
Since 2009, our team has been developing the 3DStock method in order to model the existing building stock of cities and regions. The initial emphasis was on the non-domestic stock. The method was then extended, in 2016, to the domestic stock of houses and flats. There has been a division drawn traditionally, both in academic research and in government policy, between domestic and non-domestic building stocks. [1] In reality, the two overlap extensively—as shown in this paper—with large numbers of buildings shared between domestic and non-domestic uses, which have tended as a result to be overlooked. These mixed buildings are all included in 3DStock. Figure 1 shows a part of our model of London, for an area around Camden High Street. Classes of commercial, industrial, social and domestic activity are indicated by colours. Dwellings are in grey. Notice the mixtures of flats, shops and offices within the same buildings.
3DStock is designed primarily for the study of energy use—although there are other potential applications. This has guided many of the decisions made about the models’ structure and features. Energy use and carbon emissions can be affected by a whole series of properties of buildings, including their geometrical forms and materials of their external walls and roofs, as well as the activities of the occupants and the fuels used. All these are represented in the models. The servicing systems of buildings—heating, ventilation, air-conditioning and lighting—are also important, although here it has been more difficult to obtain comprehensive data.
Three-dimensional digital models of cities are now very common, many used for visualisation, where an emphasis is placed on external appearance. In 2005, one of the present authors (S.E.) produced a model of this type, ‘Virtual London’, with colleagues at the University College London (UCL) Centre for Advanced Spatial Analysis (Hudson-Smith, Evans, & Batty 2007). This model was used by Steadman, Hamilton, & Evans (2014) to study the relationship of energy use to built form—specifically, volume, surface area and plan depth—in the complete non-domestic stock of the capital. The CityGML international standard distinguishes different levels of detail in such models, ranging from simple prismatic representations of buildings, with flat roofs (level 1) to high-resolution rendering of complex built form and surface detail (level 3) (Open Geospatial Consortium 2018). 3DStock does not sit comfortably within this spectrum, since visual appearance as such is not important for energy use. The approach does have some affinity with CityGML level 4 where details of rooms are introduced, although even here there are differences. 3DStock is not concerned with interior room layout as such; however, activities are recorded for each floor in a building, and in many cases are further broken into sub-activities in zones within floors. This means that the data within 3DStock can be used to support detailed thermal modelling.
One key way in which 3DStock differs from almost all other digital stock models is in the attention paid to the complex relationships between premises and buildings. A non-domestic premises is an extent of contiguous or neighbouring floor space occupied by an institution, organisation or business. It can be a part of one building, as, for example, an office suite in a multi-tenant office building. It can coincide exactly with one building, as typically with a church or a small school. Or it can be made up from several detached buildings on a shared site, as in a hospital, large factory or secondary school. In this last type of ‘campus’ situation, it is necessary to know the boundary of the site in order to collect all the buildings on that site into the premises in question. In the domestic stock the picture is simpler, with one household (usually) occupying one house. The relationship of flats to the converted house or purpose-built block in which they are located is similar to the case where many non-domestic premises share one building.
It is critical to the analysis of energy use that the attributes of premises or dwellings, in particular the floor areas they occupy, be attached to the correct buildings or parts of buildings. Only in this way can accurate figures be obtained for the intensity of energy use per m2 of floor area (or per m3 of volume). How this is done in 3DStock is explained in section 3 below.
3DStock models are assembled automatically from a series of sources of data, the majority of which are publicly available. These too are discussed in more detail below. In summary, building footprints are obtained from digital maps published by the UK mapping agency, the Ordnance Survey (OS). The maps provide postal addresses for these footprints. Information on non-domestic activities and the floor space they occupy is drawn from property taxation data collected by the Valuation Office Agency (VOA) of Her Majesty’s Revenue and Customs (HMRC) (VOA 2020). Local taxes or ‘rates’ are levied in Britain on buildings and other properties, not on land as in most other countries, and the agency for this purpose makes detailed surveys of the majority of non-domestic buildings. A small number of building types are not subject to rates, however, including places of worship, agricultural buildings and properties of the Crown, such as central government offices. Other types are rated, but floor areas are not measured: these include hospitals, libraries, public houses and hotels.
The classifications of the activities of businesses and institutions used by the VOA are complex and detailed. They categorise the main activities in a premises by ‘primary descriptions’, as, for example, ‘wine bar’, ‘post office’ or ‘community centre’. And they further classify the sub-activities being conducted in a premises, e.g. within an ‘office’ (primary description) they distinguish areas of floor space devoted to office work, kitchens, storage, etc. Floor areas and activities are recorded for each floor. Where the agency surveys whole buildings, its data are therefore sufficient—with knowledge of the building’s total height—to construct complete 3D models.
Otherwise external geometrical descriptions of buildings are produced from light detection and ranging (LiDAR) data, collected by overflying aircraft. In Britain, these data are available from the Environment Agency (2017). With the use of LiDAR, and by making assumptions about storey heights, the numbers of storeys in buildings not surveyed by the VOA—plus all domestic buildings—can be inferred, and estimates made of floor areas.
The boundaries of some sites occupied by buildings or groups of buildings are published by the OS. Others can be determined by the analysis of data on property ownership published by HMLR (2017). Data on structural systems, materials of walls and roofs, roof types and estimated ages of buildings are purchased from GeomniUK, a commercial company.
The special character of several of these data sources means that the 3DStock methods could not be directly applied in other parts of the world. In particular, the British approach to the ‘rating’ of premises for tax purposes is replicated only in Hong Kong and New Zealand. Within Britain itself, the VOA covers only England and Wales. Commercial rating is handled differently in Scotland and Northern Ireland, and the 3DStock method has not yet been applied to those regions. The general principles of the approach could nevertheless be adapted, we believe, to other countries: indeed, some work is presently in progress to develop parallel methods for Indian cities (Fennell et al. 2019). IEA Annex 70 is an international collaboration between researchers, industry and government, working under the auspices of the International Energy Agency (IEA), whose goal is to collect data for modelling energy use in the building stock of many countries.
2. Previous approaches to stock modelling in Britain
Databases and models of the national building stock of Britain and its use of energy have been assembled by government departments and academic groups since the 1970s. These have mostly consisted of tabular listings of addresses for dwellings or non-domestic premises, or aggregated classes of premises, with further data attached on activities, floor areas, energy use and other attributes as available.
Responsibility for policy relating to energy use in buildings within UK central government is divided between two departments: the Department for Business, Energy and Industrial Strategy (BEIS) and the Ministry of Housing, Communities and Local Government (MHCLG). BEIS covers the building stock as one sector of national energy use, and has developed stock models for the analysis of conservation opportunities, and for tracking emissions. These functions were previously the responsibility of the Department of Environment (DoE) and the Department of Energy and Climate Change (DECC), the predecessors of BEIS. MHCLG is responsible for housing policy, land-use planning, building regulation and property taxes. It collects data on the building stock and land uses. It also oversees national schemes for the energy rating of buildings via Energy Performance Certificates (EPCs) and Display Energy Certificates (DECs) (see section 3.7). The policy for energy improvement of the stock is implemented by local authorities representing cities and rural districts. London has a separate devolved government body, the Greater London Authority (GLA).
2.1. Non-domestic stock models
In 1991, the UK DoE commissioned a programme of work, the National Non-Domestic Building Stock (NDBS) project, from three teams at the Building Research Establishment (BRE), Sheffield Hallam University and the Open University (Penman 2000). The stock modelling was carried out at the Open University under the direction of one of the present authors (P.S.). Data on activities and floor areas of all non-domestic premises in England and Wales were obtained from the VOA plus a great variety of other public documents. These were not listed by individual addresses, but were aggregated into activity groups based on the VOA’s system of primary descriptions, with some modifications and additional codes.
Surveys of annual electricity and gas use were made by the Sheffield Hallam team for a subsample of some 900 premises (Mortimer, Ashley, & Rix 2000). The results were used to derive benchmark values for activities, expressed as consumption per m2 of floor area. For each activity, the total floor area was then multiplied by the relevant benchmark to derive an estimate of national consumption. The results were compared, with some difficulty, against published figures for total national energy use by sector. Built form and other attributes of construction and servicing systems were thus not represented in any way, nor was the relationship of premises to buildings.
The NDBS database was built using data for 1993–94. It was updated for 2004 for a project on Carbon Reduction in Buildings (CaRB) (Bruhns, Steadman, & Marjanovic 2006); and again for 2010 as the CaRB2 model. In 2014–15, the DECC conducted a large-scale study of energy use in a representative national sample of non-domestic premises, called the Building Energy Efficiency Survey (BEES) (BEIS 2016). The purpose was essentially to provide an update of the Sheffield Hallam surveys of the 1990s.
Around 2010, the DECC began to build two new databases of energy use in buildings, one for the domestic stock and the other for the non-domestic stock. (The latter covers only properties surveyed by the VOA.) These have since been combined into a single database, the National Energy Efficiency Data Framework (NEED) (BEIS 2013). Floor area and activity data for non-domestic premises in NEED come from the VOA. Information is incorporated about the various programmes of energy improvements promoted by government.
There are two key differences between the NEED and the NDBS and CaRB databases. The first is that dwellings and premises are listed individually in NEED by addresses. The second is that annualised figures for actual consumption of gas and electricity are introduced by matching the addresses of meters to the addresses of dwellings/premises. These annualised data are made available to government by the supply companies, in confidence, for the calculation of total consumption figures, published for different levels of spatial aggregation, either postcodes or larger districts used in compiling national statistics.
The use of actual energy consumption data rather than benchmarks clearly allows some more sophisticated and reliable analyses than did NEED’s predecessors. NEED nevertheless has several limitations. For non-domestic premises there is no method for characterising built form. What is more, there are serious difficulties in the method of matching gas and electricity meters to non-domestic premises simply by addresses, with the result that match rates in NEED are not high. The reasons for this are explained in section 3.5.
University research groups have developed models of the non-domestic building stock, or of the complete stock, for local areas. The Energy and Environmental Prediction (EEP) model produced by Jones, Williams, & Lannon (2000) derived floor areas from geographical information system (GIS) footprints, with on-site surveys of buildings made to obtain numbers of floors and other characteristics. A model was built for Cardiff, but the method was obviously limited by the manual process of data collection. Taylor, Fan, & Rylatt (2014) built a non-domestic stock model of the city of Leicester, described below in section 3.4. A team led by Ruchi Choudhary developed a detailed and sophisticated model of the domestic and non-domestic stock of the London Borough of Westminster (Tian et al. 2015) using many of the same data sources as 3DStock: VOA records, the UKBuildings product which provides information on building heights, materials and ages linked to map polygons, EPCs and DECs. Dynamic energy simulation models were built in EnergyPlus for 98,000 buildings, and the predictions compared with aggregate energy use data published by BEIS.
2.2. Domestic stock models
There is a long parallel tradition of modelling the domestic stock of Britain, dating from the 1970s. A detailed review is not presented here, not least because Sousa et al. (2017) have recently published a comprehensive critical history, covering 29 models of various kinds, to which readers are referred. The philosophy and evolution of domestic stock modelling in the UK and elsewhere has been distinctively different from non-domestic, however, and in some respects has achieved a greater level of sophistication. In essence, housing stock models have grown out of detailed simulations of energy flows and occupant behaviour in individual dwellings, in particular the Building Research Establishment Domestic Energy Model (BREDEM) (Shorrock, Henderson, & Utley 2005). Shorrock and Dunster (1997) at the BRE developed the national BREHOMES model by constructing BREDEM models of representative examples of dwelling types, and grossing the results up to the national scale. Others, including the Cambridge Housing Model, have taken a similar approach (Hughes, Palmer, & Pope 2013). There is a much greater degree of homogeneity in the sizes and types of dwellings—detached, semi-detached, terraced, apartments—than there is in non-domestic building types. This fact has made it possible to rely on a small number of dwelling archetypes, although there are still dangers that these may not be completely representative.
National data for the grossing-up process comes from the Census of population, which gives dwelling type, household size and socioeconomic details; and the English Housing Survey, which runs continuously and is commissioned by MHCLG (2012). In this survey, a sample of households is interviewed, and surveyors record the physical characteristics of houses and flats. There is, however, no public source of comprehensive national data on floor areas of dwellings, which has generally been estimated from numbers of bedrooms. (3DStock can complement other domestic models by providing floor area measurements and empirically derived statistics on the variations of form and size in dwelling types.) Energy predictions of domestic stock models are calibrated and evaluated against the aggregate energy statistics published by BEIS.
This bottom-up approach, starting from simulation models of individual dwellings, contrasts with an initial emphasis in non-domestic stock models on simply gaining an overall statistical picture of the physical and material characteristics of buildings, their occupants, and their energy intensities. Only more recently have attempts been made, with increases in computing power, to simulate energy-transfer processes and occupant behaviour in all non-domestic buildings in a locality. The use of archetypes for non-domestic buildings is much more problematic than for dwellings because of the much greater variety of size, design and use. However, this is established practice, for example, in models developed in the United States (Energy Information Administration 2020).
The Homes Energy Efficiency Database (HEED), built by the Energy Saving Trust (EST) for DECC from 2002, was different in structure. It consisted of a list of all dwellings in the UK, together with data on their physical characteristics, linked to annualised gas and electricity consumption figures in every case. Household characteristics were supplied by Experian, a consumer credit company. HEED also incorporated information about a series of government and industrial schemes for improvements to fabric, equipment and services. Hamilton et al. (2013) analysed the contents of the database in detail. In 2012, HEED was incorporated into the government’s NEED whose structure it resembles.
In both government and academic research, the halves of the building stock (i.e. domestic and non-domestic) have for the most part been treated separately, as this account has shown. As a result, mixed-use buildings have fallen into the gap and been ignored, until their representation in 3DStock.
2.3. Three-dimensional modelling of the non-domestic stock
The national NDBS database built in the 1990s, described above, was not the only product of that programme of work on stock modelling. The Open University team also developed a more detailed approach to the representation of the non-domestic stock in three dimensions, for selected areas of four English towns: Bury St Edmunds, Tamworth, Swindon and Manchester (Brown et al. 2000). This was the start of the processes of thought and experiment that led to 3DStock.
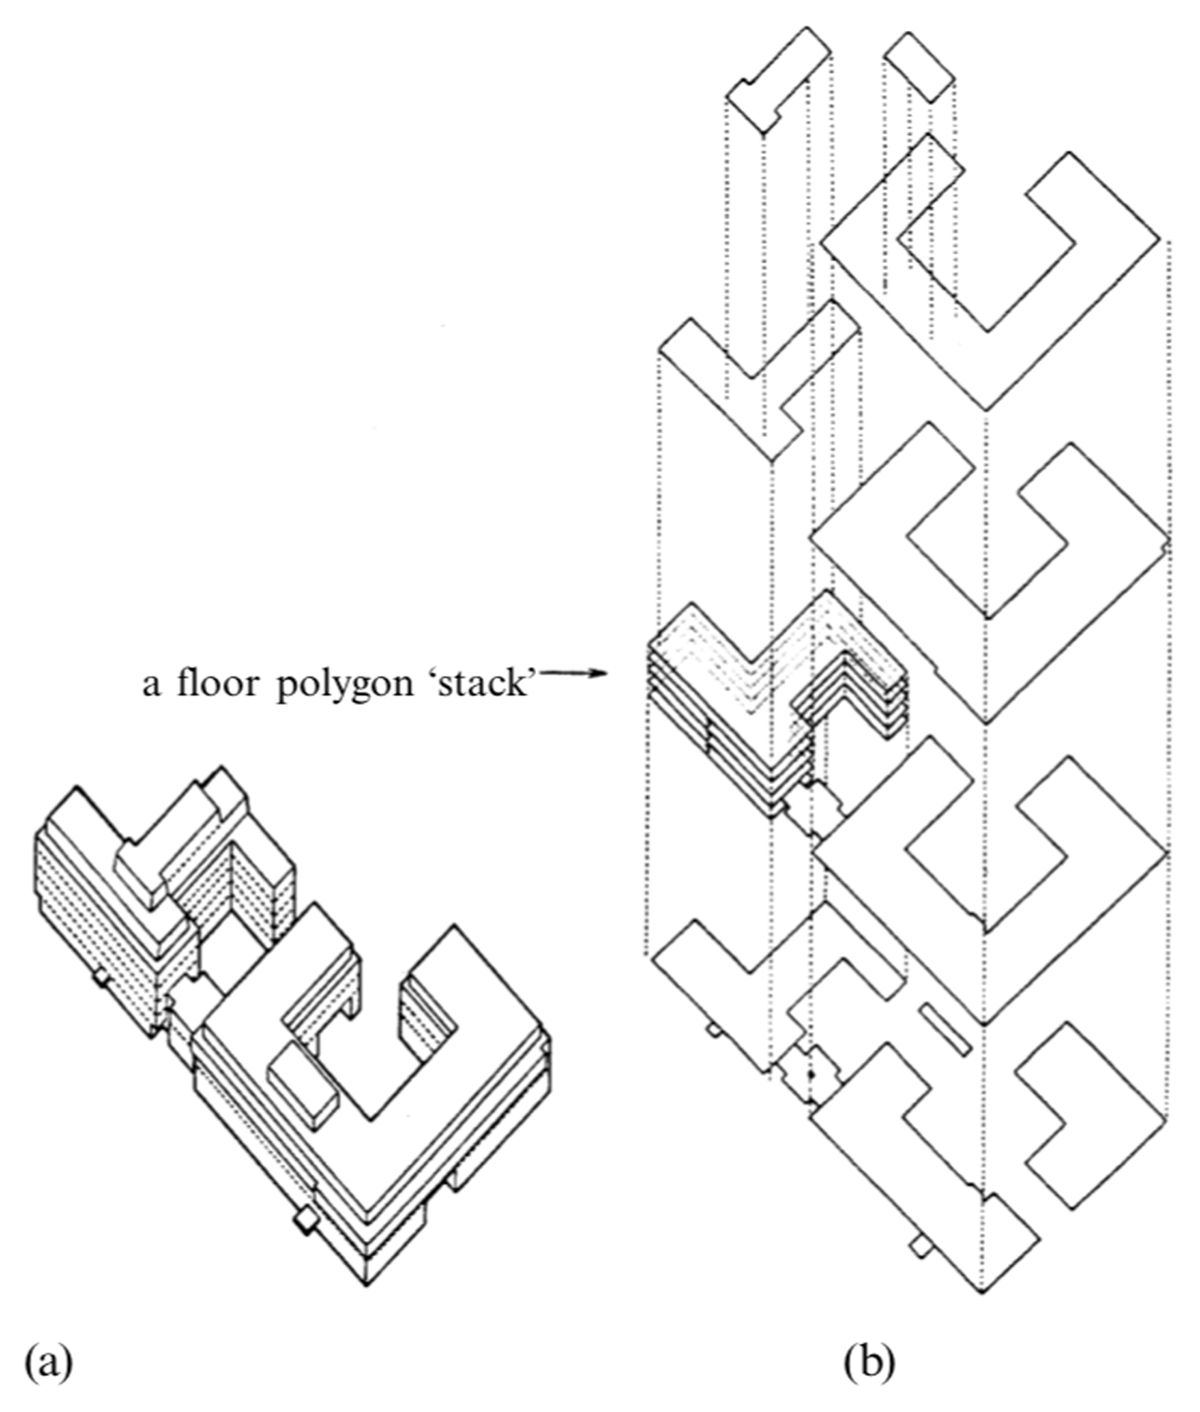
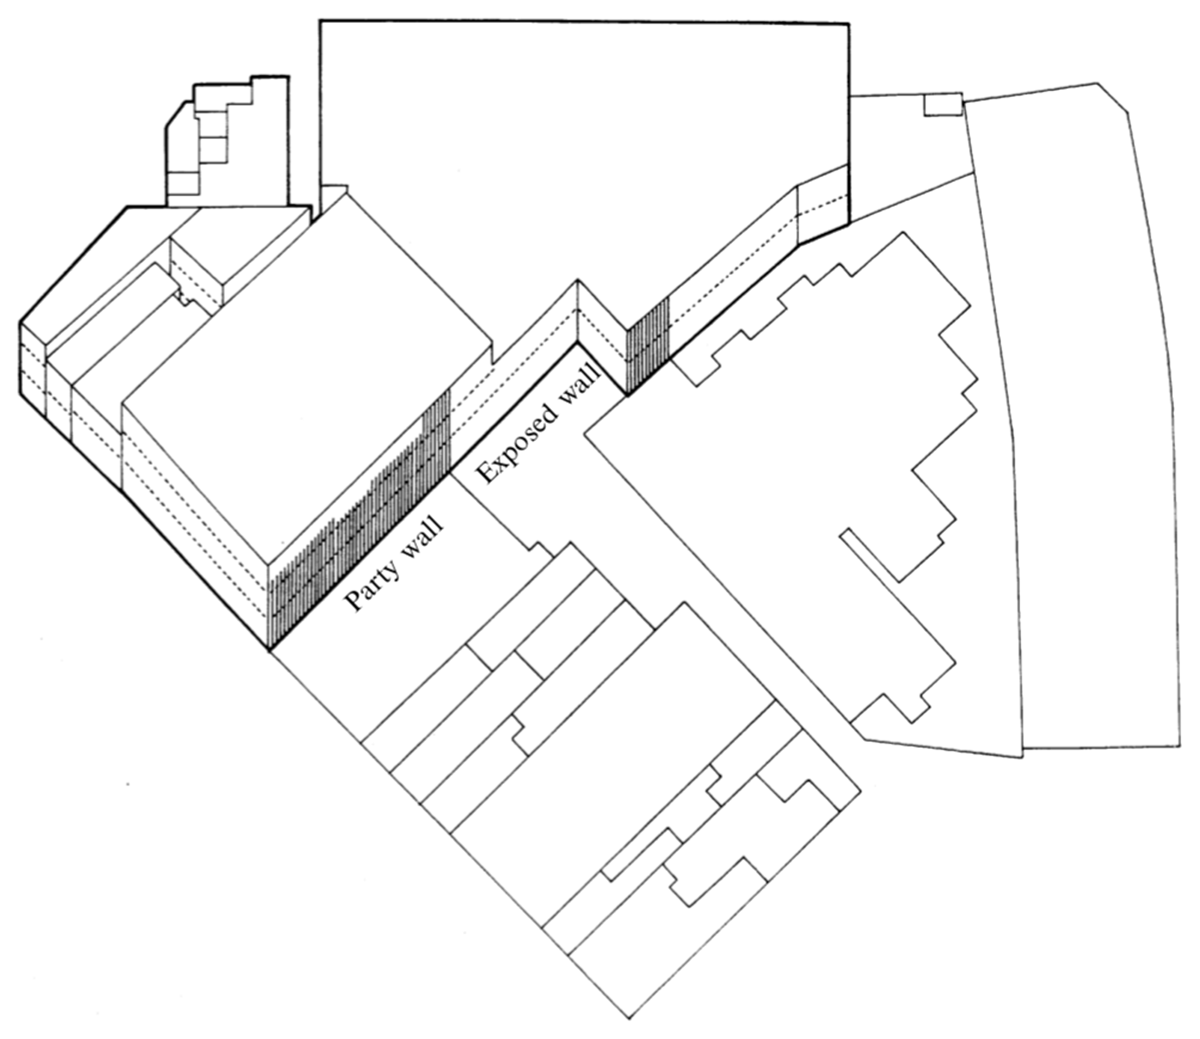
Surveys were made from the street of buildings at some 3500 addresses. Footprints of buildings were obtained from OS maps. Each floor level was divided into a series of ‘floor polygons’ corresponding to the areas occupied by different premises. These data were entered into a specially customised version of the Smallworld GIS (Holtier, Steadman, & Smith 2000). Buildings were not represented as simple prisms: with floor polygons of appropriate shapes and sizes it was possible to allow for setbacks or overhangs on upper floors. Figure 2 shows a large office building in Swindon broken into floor polygons. Floor level and storey height were assigned as attributes of each floor polygon, so that volumes, overall heights and wall areas could be computed. Figure 3 shows diagrammatically how areas of exposed wall were calculated, including those sections of party wall exposed where one building is taller than its neighbour. Equivalent calculations are made in 3DStock.
Many features of 3DStock were thus anticipated in this study. The geometrical forms of buildings were modelled in detail (with the exception of pitched roofs). Three-dimensional properties of form could be computed, even though the GIS representation was in 2.5D. Account was taken of the relationship between premises and buildings. The crucial difference from 3DStock is that data collection and entry were entirely manual. The automation of these processes has absorbed much of the effort involved in the development of 3DStock. Automatic methods have made it possible to build models of very large areas, most recently the whole of Greater London.
3. Steps in the construction of a 3DStock model
A detailed technical account is provided on how 3DStock models are built in previous papers (Evans, Liddiard, & Steadman 2014, 2016). The present paper presents a shortened summary, with an emphasis on the rationale for the various steps.
3.1. Linking premises to building footprints
The process starts from the footprints of buildings in OS Mastermap Topography layer, and the national property gazetteer in the form of OS AddressBase (OS 2020a). Buildings can then be given addresses by linking these building footprints to postal addresses with unique property reference numbers (UPRNs). In most cases a single building will have one UPRN, but in more complex situations a single footprint may have one ‘parent’ UPRN connected to several ‘child’ UPRNs for separate premises contained within the building. OS AddressBase also holds links to the unique address reference numbers (UARNs) by which non-domestic premises are identified in VOA records. [2] By means of these identifiers, premises can be associated directly in many (though not all) cases with the footprints of buildings. Otherwise links have to be made using automated address-matching routines.
3.2. Unaddressed footprints and ‘polygon capture’
Not all building footprints carry addresses by any means. One typical situation is where a polygon fronting the street, corresponding to the main bulk of the building, carries an address; but there are further polygons representing additions or extensions to the rear or the sides that are unaddressed. Another frequent case is where a shop or restaurant in a row of terraced buildings has been extended into one or both neighbouring properties, but only the original building carries the address. 3DStock copes with these issues by means of techniques for ‘polygon capture’, using a spatial topological model and combinatorial optimisation (Evans et al. 2016).
In essence, the procedure involves taking the area of the ground floor given by the VOA for the premises in question, and comparing this with the area of the addressed footprint (allowing for differences in measurement convention). If the VOA area is significantly greater, the method looks for additional adjoining unaddressed polygons, ‘capturing’ those that give the best area match. The same procedure is used on successive floor levels as appropriate. If two addresses compete for the same unaddressed polygon, the various possible solutions are compared and the optimum result retained. The search process is limited by the fact that the VOA does not usually allow premises to be broken across roads, which means that polygons need only be considered for ‘capture’ from within the same urban block.
Where a single premises consists of several buildings on a campus, it is likely that just one building—containing the main office of the institution or company—will be addressed, and all the others will lack addresses. In this case the unaddressed buildings are associated with the addressed building by means of a site boundary, obtained from the OS or Land Registry.
One further situation occurs when many premises, approximating to buildings in themselves, are covered by the ‘umbrella’ of a much larger structure. This is the case with shopping centres, airports and major railway terminals, all of which can contain shops, restaurants, cafes, etc. operated by different owners. OS maps do not provide interior plans to which the process of ‘polygon capture’ could be applied, and it is not possible to identify or measure the very large areas of public circulation space. 3DStock does not presently deal with such buildings in detail, other than to represent the geometrical envelope of the ‘umbrella’, and to record the fact that premises (with known floor areas) are somewhere inside.
3.3. Assigning floor space to floor levels, and deriving external geometry from LiDAR
The VOA gives floor levels (including basements) to which the floor areas of premises relate. Where buildings consist only of VOA premises, these data can therefore be used directly to construct 3D models on map footprints. Average storey heights are estimated from LiDAR or from data on total building height provided in the OS MasterMap Topography Layer (OS 2020b).
For non-domestic premises for which floor areas are not available from the VOA, and for all houses and flats, a different approach is taken. The probable number of floors in a building is estimated by dividing total height by an assumed mean for the floor-to-floor height, ranging from 2.7 to 4.2 m depending on the activity, and rounding to the nearest integer. These values come from the surveys made in four towns for the NDBS project (Brown et al. 2000). Where domestic and non-domestic premises share the same building, domestic is assumed to be above non-domestic, unless addresses carry explicit information about storey level, e.g. ‘Basement flat’.
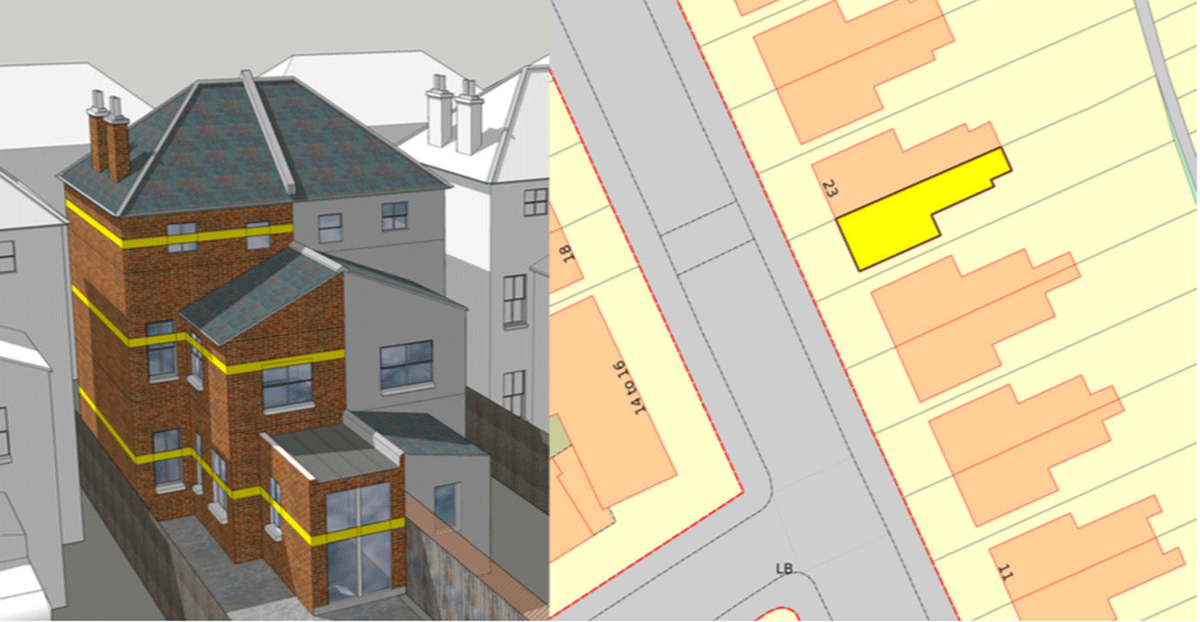
LiDAR data are then used to model the external envelopes of buildings, allowing for setbacks on upper levels. The LiDAR volume for a building is sliced horizontally at the midpoints of storeys, working from the top downwards. Floor area is calculated in each case. When a level is reached where this area equals the area of the footprint, all storeys further down are given that same area. (Overhangs are therefore not allowed for.) Figure 4 shows the method applied to a typical three-storey semi-detached house with two- and one-storey back extensions. Floor areas are measured at the levels marked by the yellow bands.
3.4. Self-contained unit (SCU)
Despite the repeated use of the word ‘building’ so far, buildings are not ideally suited as units for modelling the stock. (Indeed, in many situations it is not easy to define where one building stops and another adjoining building starts.) Non-domestic premises as mentioned can correspond to parts of buildings, whole buildings or groups of buildings on common sites. It is essential to preserve the integrity of premises, since it is these to which activities and energy consumption relate. Many gas and electricity meters relate to premises, as will be shown. (Meanwhile geometrical and material attributes relate to buildings.) Should buildings be taken as units, many premises would be broken, and it would be difficult or impossible to relate meters and energy consumption to the different parts.
Instead, 3DStock uses the SCU. This was devised by Taylor et al. (2014) for the construction of a model of the non-domestic stock of the city of Leicester. The model was built in a GIS using OS footprints and VOA premises data, linked together by the Local Land and Property Gazetteer compiled by the city. The geometrical forms of buildings accommodating some 10,000 premises were modelled automatically. This work provided a powerful inspiration for 3DStock, and Taylor et al.’s definition of the SCU has been adopted directly.
Where one or more premises occupy a building with a single detached footprint, then building and SCU coincide. The SCU concept comes into its own with groups of adjacent footprints. The process of defining SCUs can be imagined in the following way. Look down from above on a group of adjoining building polygons. Imagine vertical cuts along the lines of all party walls. If a cut results in one or more premises being divided into parts, do not make it. If a cut does not have this effect, do make it. In this way, all conglomerations of adjoining buildings are cut into SCUs, and no premises are split. For a ‘campus’ premises consisting of many buildings, one SCU comprises all these buildings that are contained by the site boundary. In the domestic stock, all houses with single households are single SCUs, as are blocks of flats. Where flats are combined with non-domestic uses in the same buildings or groups of adjoining buildings, the definition of SCUs can become more complex, but the principles outlined above apply.
One drawback to the use of the SCU is that a unit may combine several buildings of different ages, with different structural systems, and constructed from different materials. When data on these attributes, collected for buildings, are assigned to SCUs, the relationship is imprecise. However, in stock modelling, one has to choose either to take buildings or SCUs (plus premises) as units; and for all the reasons explained, we have opted for SCUs. Data that have originally been collected at different scales are aggregated as appropriate before being applied to SCUs.
3.5. Matching energy meter data to SCUs
The greatest virtue of the SCU is that it allows gas and electricity meter data to be matched reliably to SCUs by addresses, with a high rate of success. In many cases, a single premises will be served just by its own meter(s), and the relationship is unproblematic. This is the case in the great majority of houses. However, other more complex situations can arise, especially in mixed-use SCUs. The issues are discussed very clearly and in detail by Neffendorf, Bruhns, & Harrison (2009).
Where many premises are contained within a SCU, each may have one or more meters of its own, and all may share further meters between them. This happens typically, for example, in multi-tenant office buildings or blocks of flats, where each tenant has an electricity meter; meanwhile the whole building is served by a central heating or air-conditioning system with its own meter(s). Even where there are no common servicing systems, it can happen, typically in older properties such as houses converted to non-domestic uses, that premises share meters and somehow sort out the payment of bills between them. On a campus site there may be metered supplies to a central building—perhaps the office building carrying the address—from which gas and electricity are then distributed to other buildings across the site. These buildings do not therefore have their own meters, or if they do, the billing addresses of those meters are not the same as the specific buildings to which they relate.
The DECC and its successor BEIS have made annual electricity and gas consumption data available to the 3DStock project at the level of individual meters; first for the London Borough of Camden, and more recently for the whole of Greater London. These are supplied under stringent conditions of confidentiality, in connection with contract work undertaken for the departments to support policy relating to energy benchmarks and EPCs.
All electricity and gas meters have their own unique reference numbers with addresses. These are matched in 3DStock to UPRNs in OS AddressBase maps (Evans et al. 2016). The rates of successful matching in the London Borough of Camden, for example, are 97% for gas meters and 99% for electricity meters. Subsequent links to premises and EPCs are also made via UPRNs. The consequence is that, even if the exact relation of meters to premises is not known, the total quantities of gas and electricity used within a SCU can be related to its total floor area. Meters shared between premises and between buildings are all allowed for.
Here is where the power of the SCU lies. Rates of meter matching in the non-domestic part of the government’s NEED database have been low by comparison, possibly because restrictive limits are set on the matching of meter addresses. Premises are not aggregated into buildings or SCUs, and shared meters are not allowed for. This is important, since SCUs containing mixtures of domestic and non-domestic premises make up significant parts of the stock, as the 3DStock modelling of London has shown (see section 5.2).
3.6. Data on materials, construction and age of buildings
Data on materials and structural systems in 3DStock come from the UKMap and UKBuildings products sold by GeomniUK, a subsidiary of the Verisk company (Geomni 2020). These cover the whole of Greater London and many other towns and cities in the UK. Buildings are surveyed by external inspection. Estimates are made of the ages of buildings (i.e. their date of construction) and grouped in a series of date bands. The presence of basements is noted—something that cannot be detected from LiDAR, although VOA records give data on non-domestic premises in or with basements. All these attributes are associated with building addresses via footprints. In 3DStock the data are matched to SCUs. As a consequence, relationships to the component buildings within a SCU can in some cases be imprecise, as explained.
Further information on some of these attributes is obtained from EPCs and DECs (see below). The VOA also collects fabric data for premises, plus a more accurate categorisation of age than UK Buildings. These data are not publicly available at present, but could be added, should they be released. Otherwise it is planned to add age and fabric data to the 3DStock model of London from the crowd-sourcing initiative Colouring London (2020).
3.7. EPCs and DECs
EPCs are used throughout the European Union for rating both domestic and non-domestic properties (MHCLG 2020). Ratings are calculated on a numerical scale and are made public as grades from A to G, where A is most efficient. Certificates are required by law when properties are sold or rented. Surveyors make measurements of a property including its floor area, and record features relating to energy performance including heating, air-conditioning, lighting, glazing, and the insulation of walls and roofs. Energy use and carbon emissions are estimated for dwellings with the Standard Assessment Procedure (SAP) or Reduced data Standard Assessment Procedure (RdSAP), and for non-domestic premises using one of several approved simulation models. Surveyors make recommendations for energy improvements, and estimate the potential for increased efficiency, expressed as the grade that could be reached by implementing all the improvements.
DECs are required in the UK for buildings open to the public, again using an A–G grading system. These differ from EPCs in that their ‘operational ratings’ are based on actual metered use of fuels, compared against benchmarks for buildings of similar type. Both EPCs and DECs therefore provide rich sources of additional data, both on building characteristics including floor areas and on building services. All are matched to dwellings, premises or SCUs in 3DStock.
4. London Building Stock Model (LBSM)
In 2018, the GLA commissioned the UCL Energy Institute to produce the LBSM. This ‘digital twin’ for the metropolis was delivered in early 2020. The model covers all buildings—domestic, non-domestic and mixed use—in the 33 boroughs comprising Greater London. These add up to some 1.5 million houses, 1.9 million flats and around 250,000 non-domestic premises. The LBSM is adapted from the institute’s pre-existing 3DStock model of London and has most of the features described so far, as well as containing several extra data sets collected or acquired by the GLA. It provides a snapshot for 2017, and will be updated annually.
The LBSM is to be used by the GLA and boroughs to tackle fuel poverty and improve the energy efficiency of the capital’s building stock. It will support boroughs in their enforcement of the minimum energy efficiency standard (MEES). It will allow poorly performing non-domestic buildings to be identified, and will help small and medium-sized enterprises, and individual property owners and householders, to plan energy improvements to their premises, reduce their energy bills and cut carbon emissions.
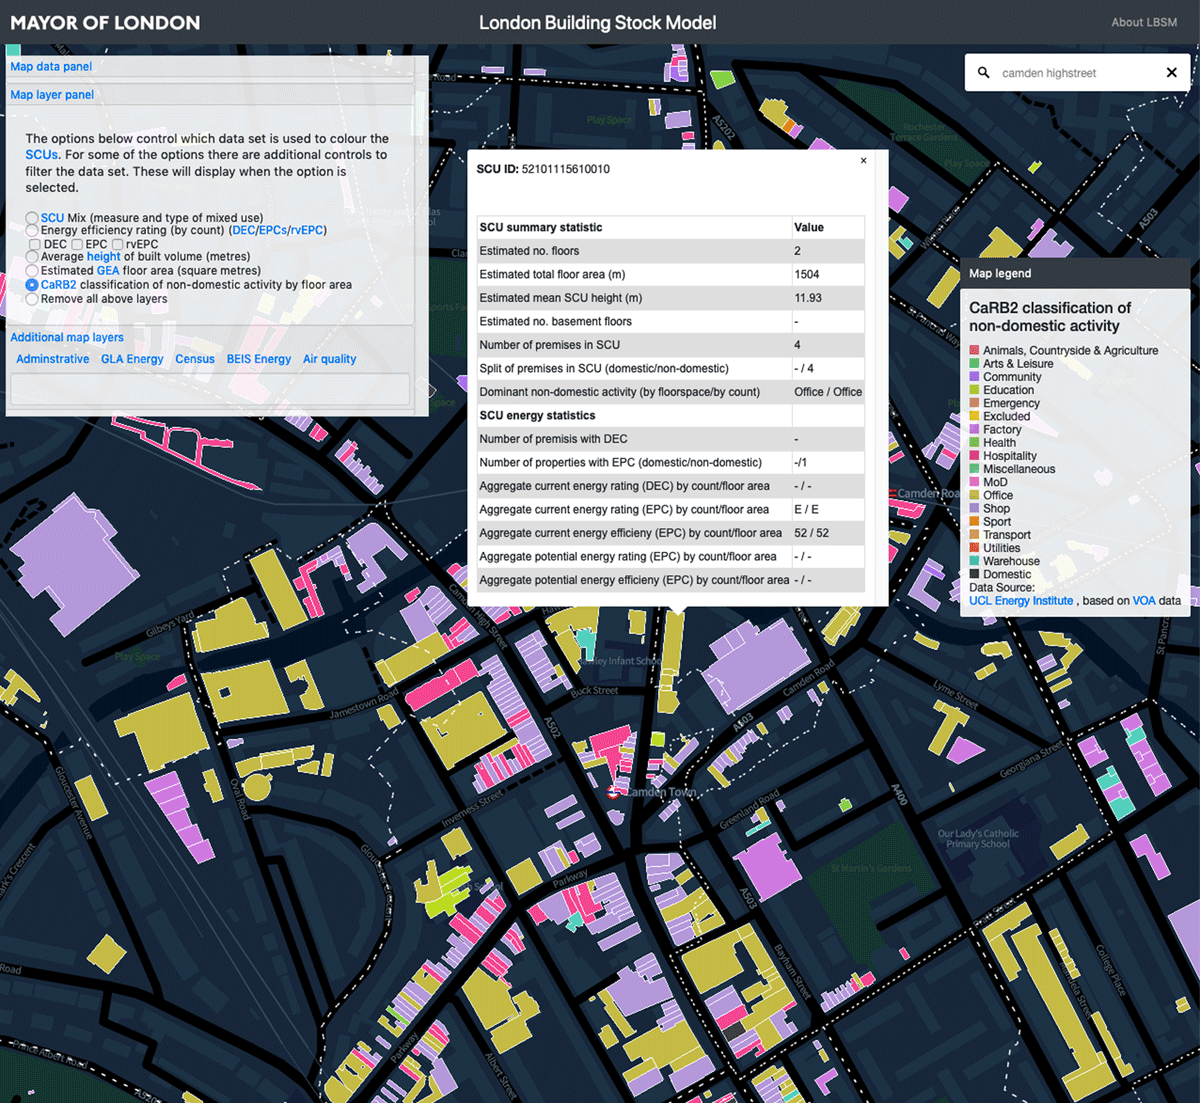
The LBSM differs from 3DStock in being delivered online in a 2D map interface, in two versions: one for internal use by the GLA and boroughs, the other for the general public and containing less information (www.lbsm.org.uk). Each has a series of map layers showing the following data for SCUs: average height, total floor area, age, rateable value (from the VOA), and the degree of mixing of domestic and non-domestic uses (Figure 5). The GLA version also contains maps showing economic opportunity areas, conservation areas, district heating networks, energy efficiency programmes, census data, air quality data and low emission zones. Users can interrogate individual SCUs by clicking on footprints. Tabular data are presented in pop-up windows, including geometrical information on floor areas, volumes, external wall areas and attachment to neighbouring SCUs (Figure 6). Data are given separately on all premises and their activities. Summary information is provided from EPCs and DECs. The maps can be searched by addresses.
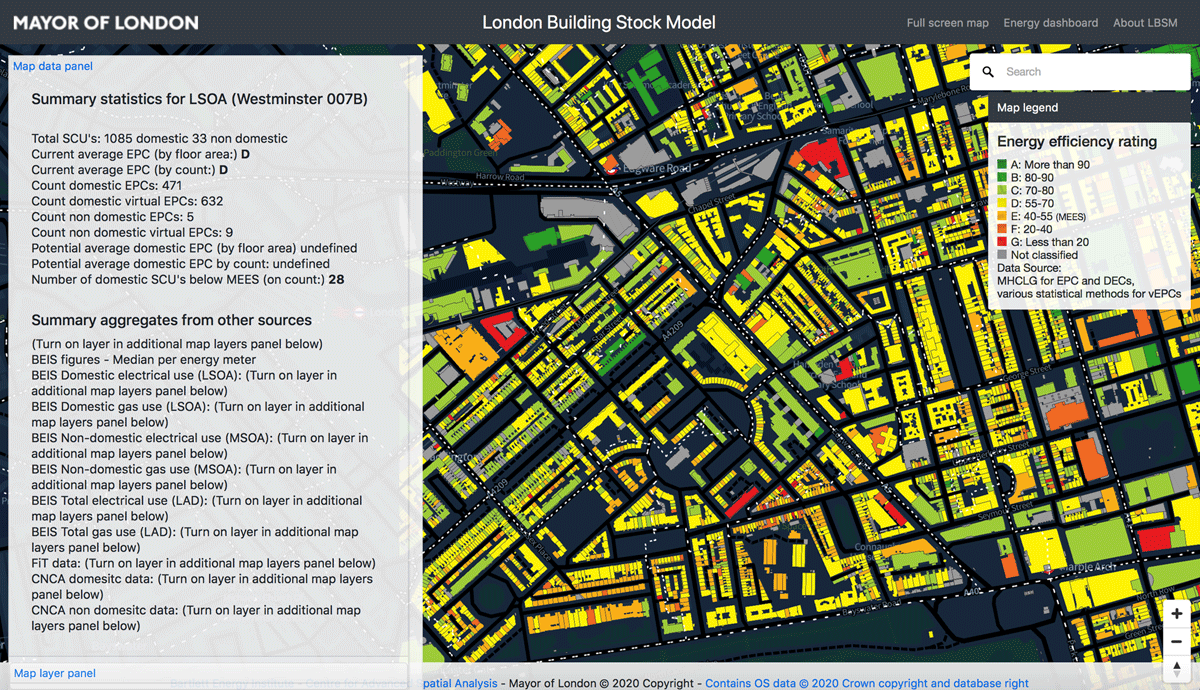
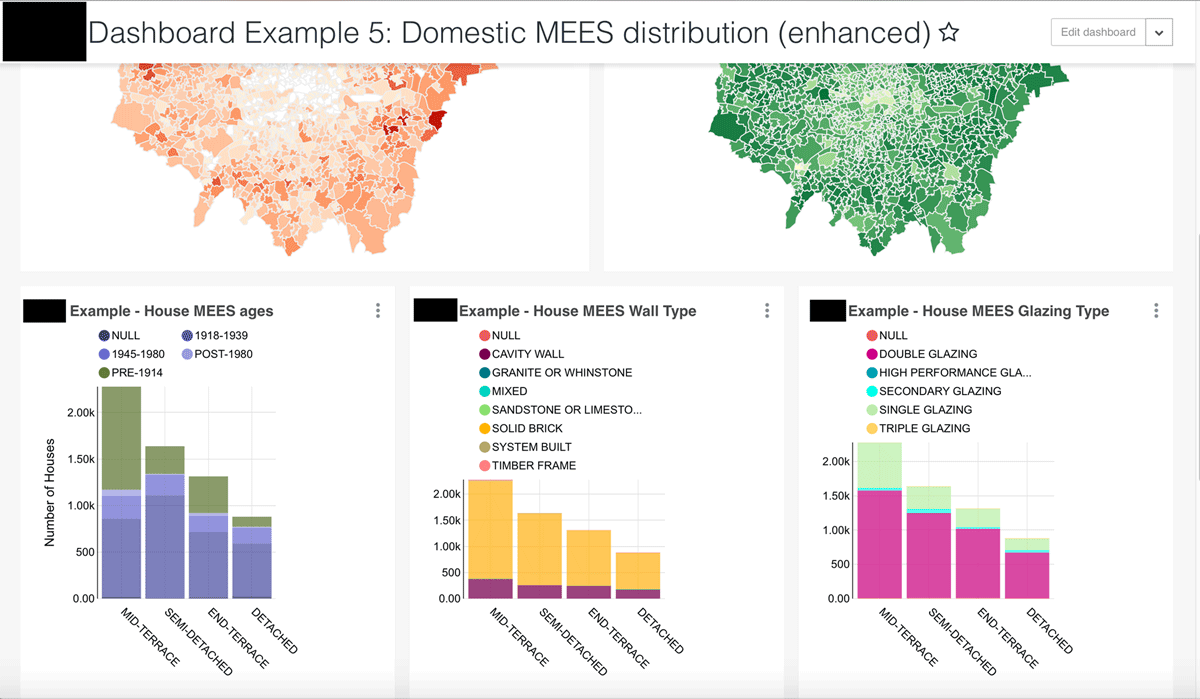
Another window provides aggregate statistics for geographical areas, ranging from lower level and middle-level super output areas (LSOAs and MSOAs), through boroughs, to the entire city (Figure 7). LSOAs and MSOAs are spatial units used in official statistics. They typically contain resident populations of around 1500 and 6000 persons, respectively. For the GLA and boroughs a powerful analysis facility is provided, based on the Superset tool developed by Airbnb (2020). This allows for a great variety of forms of analysis to be carried out with minimal need for programming, with results given in the form of tables, graphs and charts. Standard sets of analyses are provided for with pre-prepared ‘dashboards’ (Figure 8). More complex or specialised queries can be made using the Structured Query Language (SQL). Data can be accessed by or exported to desktop GIS such as ArcGIS and QGIS.
Meter-level data for gas and electricity consumption from the supply companies cannot be included in the London model for reasons of confidentiality. Instead the model incorporates aggregate energy statistics for LSOAs, MSOAs and in some cases postcodes. DECs, which give figures for actual consumption, are provided for public buildings. In EPCs—both domestic and non-domestic—consumption is modelled, as described. Only around 46% of properties in London (up to 2016) have EPCs, however. In LBSM, properties that lack EPCs have been assigned ‘virtual EPCs’. These are calculated by searching around the target dwelling or premises for properties of similar character that have certificates, and assuming the target would obtain a similar grading. Premises closer to the target—for instance, other flats in the same block—are given heavier weightings in this process. DECs, EPCs and virtual EPCS are all shown on maps.
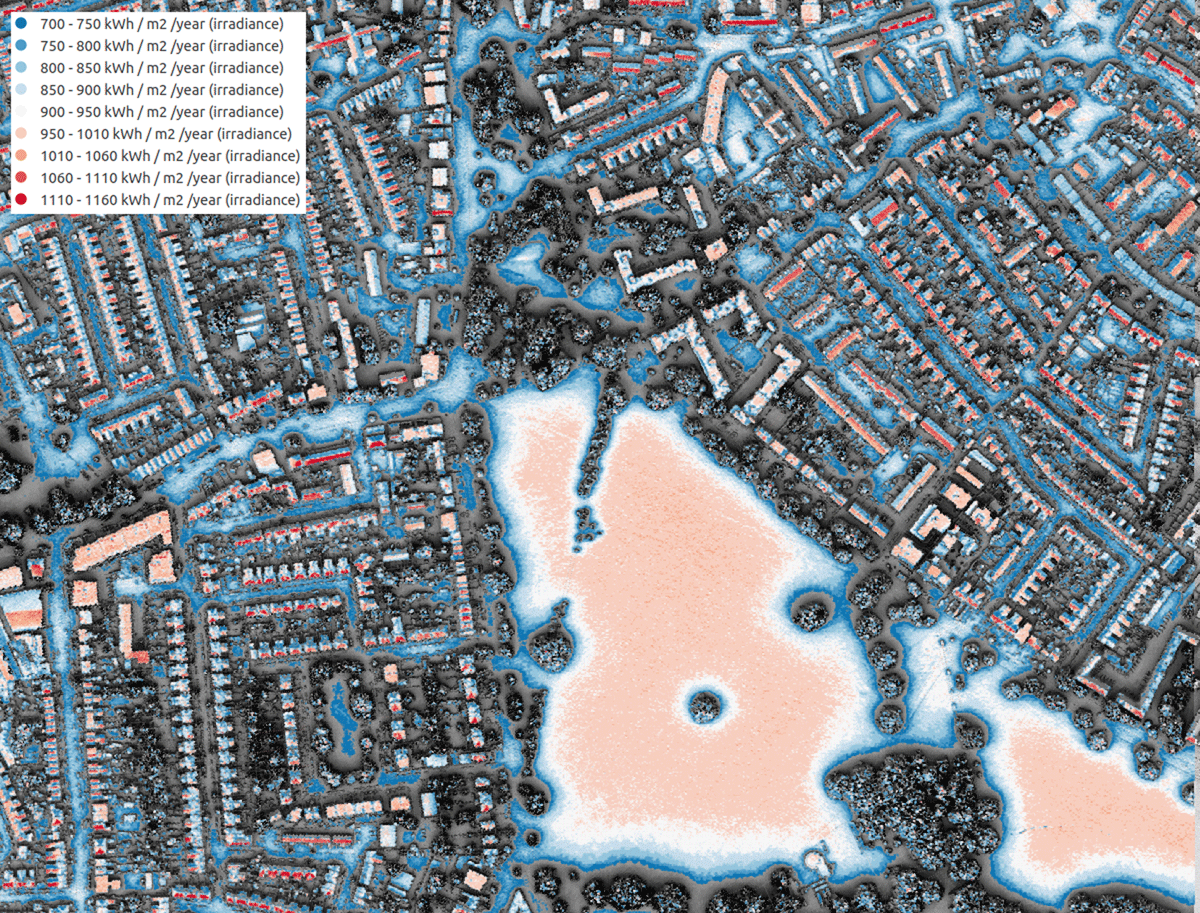
In a further development in 2020, the London Solar Opportunity Map will be added, giving estimates of the total annual direct and diffuse solar radiation falling on all roofs and areas of open land, at a resolution of 50 cm, taking account of over-shading from adjacent buildings and trees (Figure 9). This too will take the form of a public web interface. Estimates will be provided of the potential electrical and thermal output of photovoltaic (PV) and solar heating installations, depending on their technology. Through links to LBSM, it will be possible to know details of the buildings beneath the roofs, and the character and uses of the land areas.
5. Scientific and policy applications of 3DStock
3DStock models have been put to a variety of uses in building science and energy policy (besides LBSM). Most of the results have already been published elsewhere. Brief summaries are presented below, with an emphasis placed on the methodological and conceptual issues involved, to illustrate the range of possible applications.
5.1. Energy epidemiology and the 100% sample
Much previous work on energy use in the stock has relied on measurements made on statistical samples of buildings, with inferences then drawn to the urban or national levels. Examples include the Sheffield Hallam and Open University surveys for the NDBS project in the 1990s and the UK government’s BEES survey of 2014. Despite the high cost and great effort involved, these surveys covered only very small fractions of the national stock. 3DStock by contrast creates something near to ‘100% samples’. These open up wholly new scientific opportunities. Sampling bias is a much less serious issue. In the non-domestic stock, distributions of size can be heavily skewed, and so reliance on small, supposedly representative samples can be dangerous. By analysing data on very large populations of buildings and their actual metered energy consumption, it becomes possible to detect subtler and more nuanced effects and relationships than with the small samples that have characterised much previous work. This new approach has been termed an ‘energy epidemiology’, by analogy with the statistical study of factors affecting disease in medical epidemiology (Hamilton et al. 2013).
5.2. Extent of mixed activities
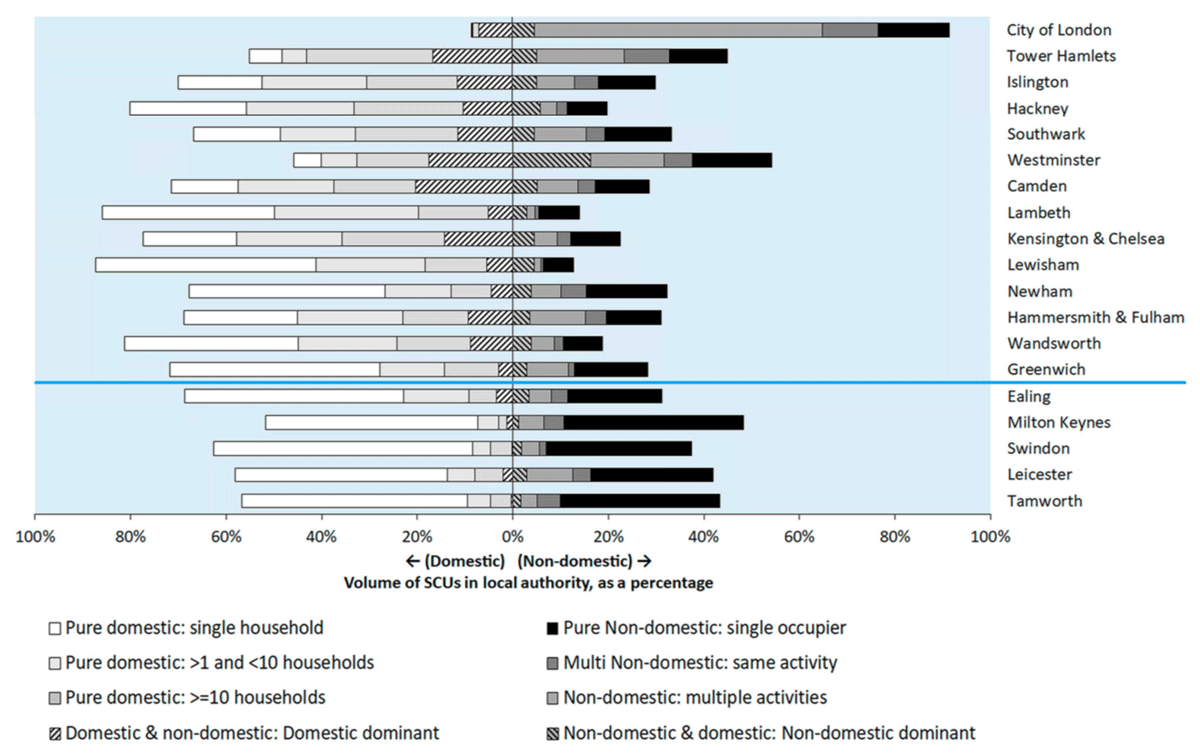
The fact that 3DStock represents the relationship between premises, buildings and SCUs has made it possible for the first time to measure the extent of mixing of domestic and non-domestic uses in the stock (Evans, Liddiard, & Steadman 2017). This has been done for all SCUs in 15 London boroughs, all but one of them in Inner London, plus the cities and towns of Milton Keynes, Swindon, Leicester and Tamworth. Eight types of SCU were defined as follows:
- Pure domestic: one domestic address (i.e. a house).
- Pure domestic: from two to nine addresses, likely to be large houses converted into flats.
- Pure domestic: 10 or more addresses, likely to be purpose-built blocks of flats.
- Domestic mixed with non-domestic: where domestic >50% of the floor area.
- Non-domestic mixed with domestic: where non-domestic >50% of the floor area.
- Non-domestic: multiple premises of different activity classes.
- Pure non-domestic: multiple premises of the same activity class.
- e non-domestic: one non-domestic premises.
Figure 10 shows the total volume (m3) of SCUs of these types in the 19 boroughs and cities. Those groups within which domestic and non-domestic are mixed are marked by diagonal shading. Notice the greater extent of mixing in London compared with the other cities, because of the higher densities in the capital; and the very great volumes of mixed-use SCUs in Tower Hamlets, Camden and especially the City of Westminster. For Inner London as a whole, around 7% of SCUs by number contain either multiple non-domestic activities and/or mixtures of domestic with non-domestic. By taking a 250 m-wide transect across the whole of London and plotting these classes, it was possible to quantify the spatial relation of mixing to density. Mixed-use buildings, as mentioned, have been largely ignored in previous stock modelling work.
5.3. Density and energy use
Because 3DStock models contain comprehensive data on floor areas, these can be used to calculate densities across urban areas as floor space index (FSI) values. FSI is defined as total floor area divided by ground area, and can be measured for individual sites, city blocks or districts. There are methodological issues involved in allocating the areas of streets and other open land, where gross densities are calculated automatically for larger zones—although experiments have been made with possible approaches. Housing densities can alternatively be calculated as dwellings per hectare.
A study of density and energy use was made using combined data from 3DStock models of 15 London boroughs plus the cities and towns of Milton Keynes, Leicester, Swindon and Tamworth, comprising some 1.1 million domestic buildings (Evans et al. 2018). Housing densities were calculated for postcodes, and dwellings were characterised as detached, semi-detached, terraced and flats in either small or large blocks. As might be expected, these types are found in the order listed, concentrated within successive ranges of density, each type replacing the next as densities rise.
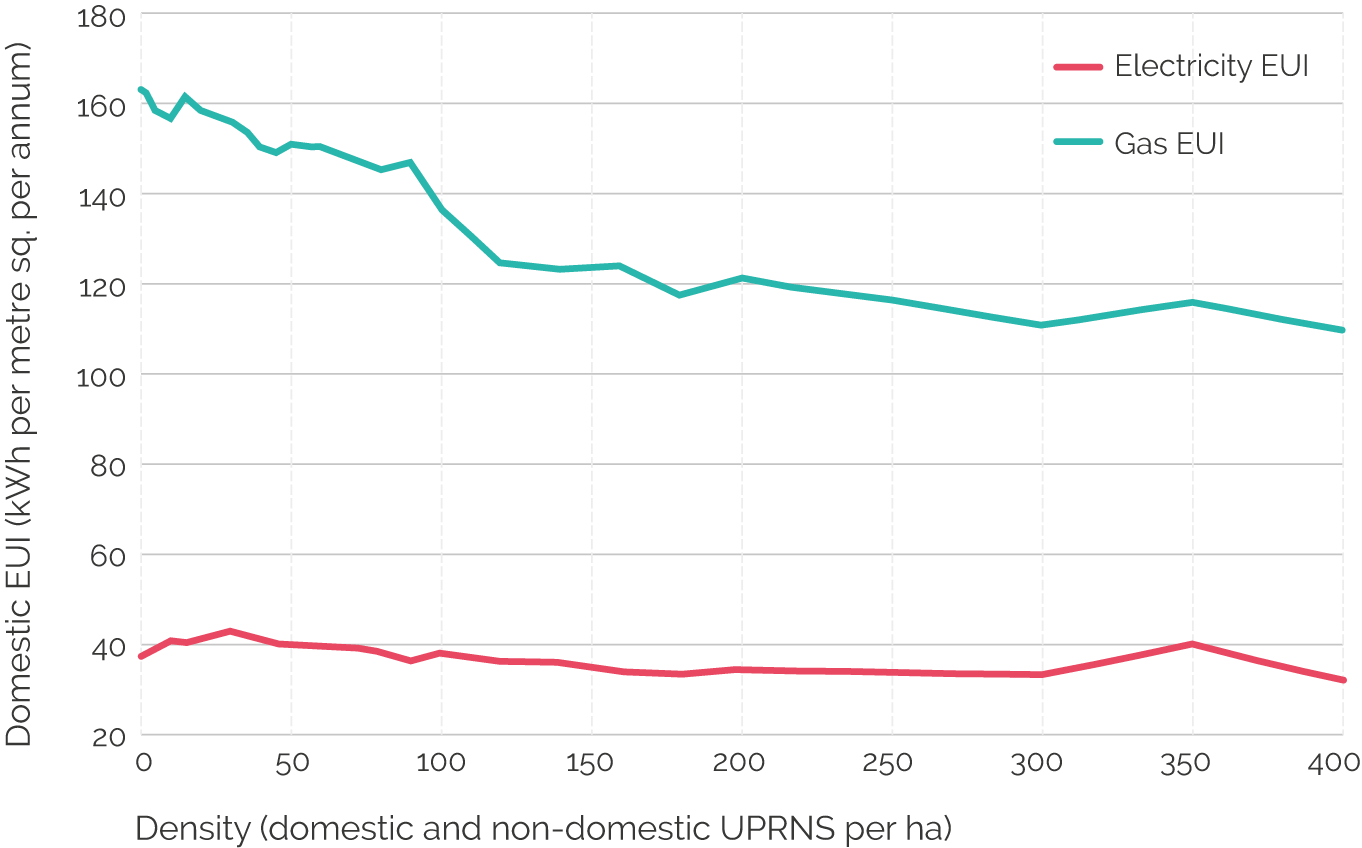
Figures for total gas and electricity use by postcodes for all dwellings were obtained from government statistics. When these were compared against density, a slow decline in electricity use from 40 to 35 kWh/m2 was observed up to 300 premises per hectare, followed by an apparent increase (Figure 11). Meanwhile, a marked decline over the same density range was observed in gas use, from 160 to 115 kWh/m2. This can be attributed to the decrease in exposed surface area associated with the sequence from detached to semi-detached to terraced to flats, and the resulting increased efficiency of gas use for space heating.
5.4. High-rise buildings
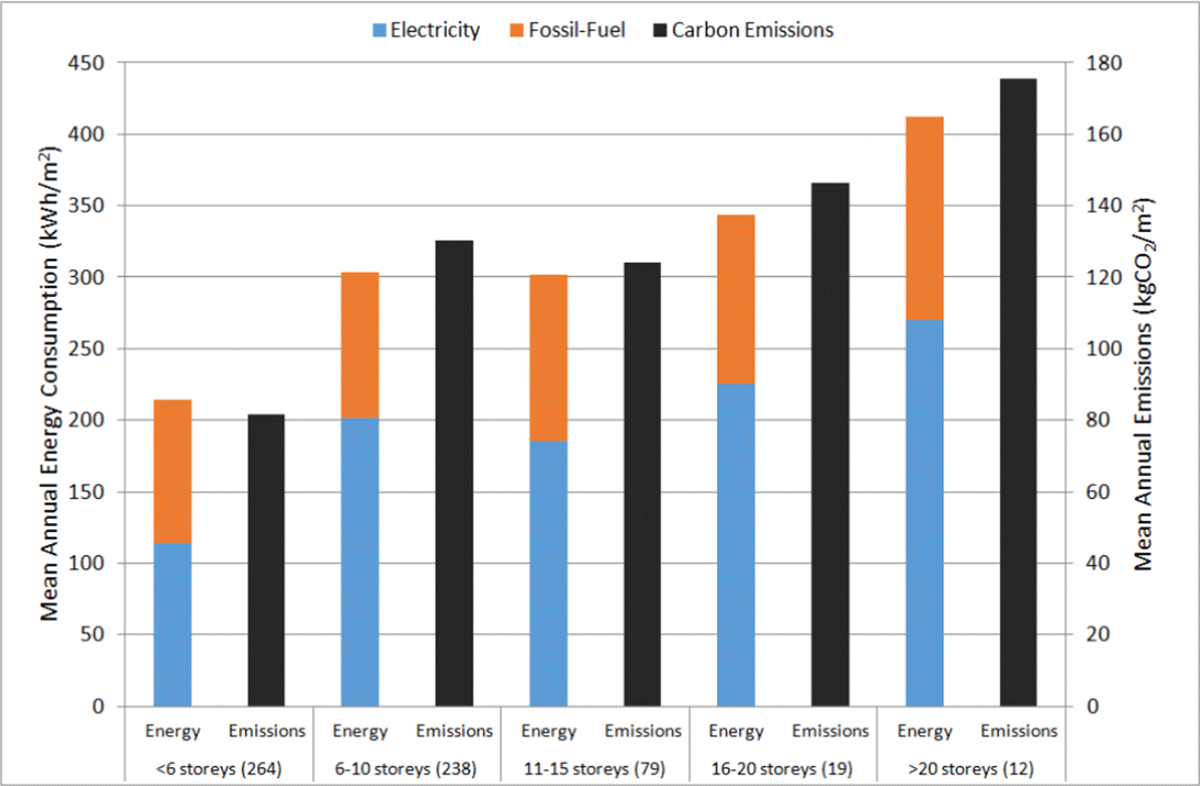
The work on domestic consumption and density used energy data aggregated to the level of postcodes. Meter level data will allow future studies of energy and density to be more precisely focused. One project already completed using meter data for individual SCUs was a study of the relationship of building height to energy use in offices (Godoy-Shimizu et al. 2018). For this work, figures for annual consumption of fossil fuels and electricity in some 600 office buildings of different heights were obtained from three sources: DECs, the Better Buildings Partnership, and a competition run by the GLA, the London Mayor’s Energy Challenge. Data on built form, construction and services came from various sources including 3DStock. The results showed that, going from five to 21 storeys, mean intensities of electricity and fossil fuel use increased by 137% and 42%, respectively, and mean carbon emissions per m2 were more than doubled (Figure 12).
A follow-up study is planned to investigate the hypothesis that this striking effect is caused by greater exposure of taller buildings to lower temperatures, stronger winds and greater solar gain in summer. The work will make use of the 3DStock model of London and matched meter data from BEIS, to examine tall residential buildings as well as a much larger sample of offices. 3DStock will be used to quantify the extent to which each high-rise building is surrounded and overshadowed or not by its neighbours.
The project on tall buildings was also concerned to demonstrate the fallacy of the popular wisdom that in order to raise densities it is always necessary to build higher. Measurements of density (FSI) at the block level across London, made using 3DStock, show, for example, that the same density can be achieved in buildings of courtyard form on five or six storeys, as in freestanding towers on 10–15 storeys.
5.5. EPCs, actual energy consumption and retrofit potential
The fact that both EPCs and meter data are linked to dwellings and premises in the 3DStock model of London allows systematic comparisons between actual energy use and the modelled estimates of consumption, assuming standard occupancy, in the EPCs. A study, in progress for BEIS has shown a reasonable correspondence with actual consumption for domestic EPC grades in the middle of the A–G range, but significant discrepancies at the extremes of the range. Examined by age band, houses built between the World Wars are found to be surprisingly energy inefficient compared with pre-First World War houses.
EPCs, as mentioned, include recommendations by surveyors for improvements to the fabric of the envelope, improvements to services and the installation of low or zero-carbon technologies. A study of 600,000 houses in London with EPCs, focused on envelope measures, has calculated and mapped the percentages of houses for which roof insulation, wall insulation and improved glazing are suitable, given the present state of the properties (Godoy-Shimizu et al. 2020).
5.6. Energy benchmarks
Several organisations have in the past produced benchmark values for the intensity of gas and electricity use in dwellings and non-domestic buildings, as guides to average consumption and targets to be achieved or improved upon. The Chartered Institution of Building Services Engineers (CIBSE) published non-domestic benchmarks in its Technical Memorandum 46 (CIBSE 2008). These provide the standards against which the A–G grades of DECs are calculated. The Sheffield Hallam and BEES surveys have also been used to produce benchmarks. In all cases, the classifications are by activity, using different systems of categorisation.
All these benchmarks are based on data from samples of buildings that are small relative to the stock, and in the case of TM46, derived from an eclectic range of sources, very eccentrically classified. [3] Analysis of the TM46 values against actual consumption as given by the DECs database shows that the means for some activities, including offices and schools, are reasonably close to the CIBSE benchmarks, but for other activities they diverge widely (Hong & Steadman 2013). By contrast, the 3DStock model of London matched to meter-level data allows actual energy intensities to be measured for millions of dwellings and hundreds of thousands of non-domestic premises. This work is in progress in 2020 for BEIS.
These benchmarks do not need to be just for activity groups, but can take other characteristics of buildings into account. Domestic benchmarks have traditionally been calculated for different house types (detached, semi-detached, etc.). This categorisation can be further refined, using 3DStock, to take account of age, materials, size and compactness of dwellings; or, for example, in the case of blocks of flats, low- and high-rise. Benchmarks can be produced for different geographical areas, as, for example, Inner London and Outer London.
Calculations made of energy intensity from the Sheffield Hallam Surveys and from the 3DStock model of Camden showed extremely wide distributions within certain non-domestic activity groups. The intensity of total energy use in shops in the Sheffield Hallam data varied by a factor of 20 between highest and lowest, depending in part on the type of goods sold. DECs and other sources show marked differences in energy intensity for office buildings with and without air-conditioning. Such differences could be allowed for in the careful design of multi-criterion benchmarks, based on systematic experiment.
One serious conceptual problem raised by energy benchmarking is how this should be done for mixed-use SCUs. Should benchmarks be defined for ‘typical’ patterns of mixture, such as flats over shops or offices over shops? (However, the proportions of floor area devoted to these uses within SCUs can vary widely.) Alternatively, might it be possible to derive benchmarks for pure domestic and pure non-domestic activities, apply these values pro rata to the component premises of mixed-use SCUs, and compare the resulting estimated total consumption with actual total consumption? These are topics for continuing research.
5.7. Energy simulation and the SimStock model
3DStock and the LBSM present snapshots of the state of the stock at fixed points in time. For the purposes of energy policy, planning and design, it is necessary to make predictions of future performance of buildings and stocks, using simulation. In the NDBS project of the 1990s, this was done with the National Nondomestic Buildings Energy and Emissions Model (N-DEEM) (Pout 2000). This model took a sample of representative actual buildings of different types and modelled a series of energy improvement measures in each case. The savings associated with these measures were then extrapolated to the national stock. The Commercial Buildings Energy Consumption Survey (CBECS), operated in the United States since 1979, works in a broadly similar way (Energy Information Administration 2020). In CBECS, a series of theoretical building ‘archetypes’—large office, small office, large retail, small retail, hospital, etc.—are used for simulation.
The advent of detailed models of complete stocks, together with advances in high-performance computing, make possible a new approach in which dynamic thermal simulation models can be run for all buildings within an area of analysis. Any dangers of the possible unrepresentativeness of samples or archetypes are thus avoided. The SimStock model developed at UCL is adapted from EnergyPlus and draws data on building geometry, materials and activities directly from 3DStock (Ruyssevelt 2019). Inferences about power-using equipment are made on the basis of VOA data on sub-activities within floors and the Sheffield Hallam and BEES surveys. Default assumptions are made about other services and hours of occupancy. Large numbers of buildings are simulated in parallel. There are similarities with the work of Tian et al. (2015). Possible analyses include the potential for retrofit measures, the potential for renewable technologies, demand-side management, daylight assessment and estimates of the risks of overheating.
6. Future developments and potential applications
Other recent and ongoing applications of 3DStock include a study of the opportunities for waste heat recovery from underground sources in London (UCL Energy Institute 2020), and work for the UK National Health Service (NHS) to identify opportunities for PV installations and heat pumps on the buildings and in the grounds of the NHS estate.
3DStock models are static, and made for specific dates. In time, as models are constructed for successive years, it will become possible to track dynamic trends both in the detailed composition of the stock, and in energy improvements and patterns of energy use. The London model is to be updated annually. Data are to be recorded via a special portal under development for the GLA on new building projects in London for which planning permission is given, together with information on their predicted energy use, and in time on their actual energy use.
There are future possible applications in fields outside energy studies, for which highly detailed 3D models of the urban fabric and its occupants can be useful: in public health, the modelling of air pollution and the tracking of material flows in the construction cycle. Buildings are the terminals of many infrastructure systems and networks: transport, energy and water supply, and telecommunications. They are the origins and destinations of the great majority of journeys. Building stock models might in principle be integrated with national digital twins of these systems, and with land use and transport models at the city and national scales, for which they could supply data on origins and destinations of trips.
Several technical developments of 3DStock are envisaged for the near future. The LBSM is presently online in 2D, and perspective images of 3DStock models such as Figure 1 have been produced ad hoc. For future models we have been experimenting with interactive 3D rendering, by which users can interrogate models graphically onscreen.
More data sets could be added, and improvements made to existing data. Methods are being investigated for using remote sensing and computer vision to capture, for example, data on glazing, existing PV installations, detailed roof forms and ‘roof clutter’. UCL is collaborating with Sheffield University and the Active Building Centre, which are developing methods for recording detailed data on the materials and construction of existing buildings, sensed remotely from a vehicle on the street. These data will be used in a 3DStock model of the city of Sheffield to complement the vertical LiDAR measurements of heights and roof forms.
Plans are under consideration to extend the modelling to the whole of England and Wales. This would allow applications to national energy policy, the creation of planning tools for other towns and cities besides London, and the provision of information to the construction industry, non-governmental organizations (NGOs) and campaign groups nationally.
Notes
[1] In North America it is conventional to distinguish ‘residential’ from ‘non-residential’ stocks. We avoid this nomenclature, since there are many residential building types that are not houses or flats, as, for example, hotels, prisons and boarding schools. Others refer to non-domestic buildings collectively as ‘commercial’, but this too is misleading, since the complete non-domestic stock contains many types of public building. The picture is further complicated by the fact that carbon emissions are reported in the UK from the ‘Residential and Public sectors’, the ‘Business sector’ and ‘Energy Supply’.
[2] The Valuation Office Agency uses the term ‘hereditament’ (a piece of heritable property) to describe a premises.
[3] Activity codes are duplicated in TM46. Some codes cover just parts of buildings. Codes overlap and are defined at different levels of generality. Building-type descriptions are vague, esoteric, mysterious or highly specialised (‘Sacred place’, ‘Law facilities’, ‘Simulator’, ‘Mess, warrant officers and sergeants, catering only’). Important types are missing. Large numbers of codes have never been used in display energy certificates (Hong and Steadman 2013: sect. 7).
Acknowledgements
The London Building Stock Model (LBSM) and the London Solar Opportunity Map were commissioned by Agnieszka Griffin at the Greater London Authority (GLA).
Publication details
Steadman, P., Evans, S., Liddiard, R., Godoy-Shimizu, D., Ruyssevelt, P., & Humphrey, D. (2020). Building stock energy modelling in the UK: the 3DStock method and the London Building Stock Model. Buildings and Cities, 1(1), 100–119. doi: doi: 10.5334/bc.52
Banner photo credit: Alireza Attari on Unsplash