
Noel Cass, Karen Lucas, Muhammad Adeel, Jillian Anable, Milena Buchs, Robin Lovelace, Malcolm Morgan and Caroline Mullen
Summary and introduction
The Centre for Research into Energy Demand Solutions (CREDS) is a research programme dedicated to understanding the role of reduced energy demand in the UK’s transition to a net-zero carbon society.
This research project investigated the households with the highest energy consumption for transport (e.g. cars, aviation) and for domestic use (e.g. heating, cooking, washing). The research aims to understand how to best define high energy use, what factors made households consume more energy, and to develop and assess approaches that could lead to fair, radical reductions in energy use.
The project first conducted secondary analysis of national quantitative data sets, followed by qualitative interviews with high energy consuming households. Finally, a deliberative process tested out and collected public responses to policy options for reducing energy consumption, especially of the highest energy users.
Reducing energy consumption in households where energy use is highest offers a potentially efficient and equitable approach to reducing energy demand. Reducing demand for energy makes the shift to zero carbon energy sources easier and cheaper to achieve. Recent research suggests that energy efficiency and demand reduction measures across the economy could contribute around half of the cut in carbon required by 2050.
Section 1: Understanding definitions of ‘excess’ – why is it important?
This section of the report describes the complexity of finding an appropriate description of high or excess energy use: there is no clear definition of excess or over consumption. Ten related definitions emerged from the research: six quantitative (e.g. average, top percentages); and four qualitative (e.g. minimum standards, wants).
Section 2: Who is consuming excess energy? Quantitative data analysis
Analysis of UK national and regional data of household energy and transport use patterns identified geographical areas where energy use was higher than average.
The quantitative analysis shows that higher income is associated with high energy demand across all domains – home energy, motor fuels, and other travel, especially air travel, and all other consumption. However, the strength of association between income and energy demand differs across these domains. High levels of home energy use are the most evenly distributed across income groups, while air travel is most unevenly distributed across income groups.
Section 3: How do high energy households view their consumption? Interview analysis
Thirty interviews with individuals from these areas explored their high energy use and their lifestyles in more detail. These households had high gas and electricity usage (monthly bills over £120: the UK mean) and high mobility-related energy consumption based on criteria including numbers of annual return flights, ownership of multiple cars, and annual car mileage.
The interviews confirmed known drivers of high domestic energy consumption e.g. large houses heating many rooms. They also revealed many more sociological drivers of both high domestic and travel-related energy consumption by the wealthiest.
Section 4: Which policy approaches could reduce excess household energy consumption?
Four deliberative workshops tested the perceived fairness of policy options for reducing high energy consumption. Participants were from the full range of domestic and travel-related energy consumption profiles.
Participants demonstrated an understanding that demand needs to be reduced, and that policies beyond those that ‘work with the grain of consumer choice’ will be required to address rising energy consumption in areas such as home heating, air travel and car use.
There were differences of opinion on the best policy packages for reducing different types of energy consumption, based on their effectiveness, fairness and acceptability. Some people thought rationing (e.g. a frequent flyer levy) would be most appropriate to reduce air travel, whereas structural change (e.g. adequate public transport) would be needed to reduce car use.
Section 1: Understanding definitions of ‘excess’ – why is it important?
Energy use for homes (e.g. heating, appliances) and transport (e.g. cars, flights) represents two-thirds of the UK’s total energy consumption (BEIS, 2020) and these continue to be the main ways that individuals contribute to the UK’s carbon emissions. However, there is significant variation in energy use between households (see Figure 1), so reducing energy use in high-consumption households could be an efficient and equitable way to reduce overall energy demand within the UK.
This research project investigated over-consumption or excess use of energy in everyday domestic and personal travel: to understand it and to suggest how it might be fairly tackled in efforts to reduce energy demand and carbon emissions.
The researchers used domestic energy and travel data analysis and interviews to talk to people we identified as high-end consumers of domestic and travel-related energy, and deliberative workshops to discuss policy options. Acknowledging the intrinsically judgemental concept of ‘excess’, interviews did not grill the participants on how excessive their energy consumption was, but instead sought an insider’s view of energy consumption through their homes, devices, and everyday lives and lifestyles.
Here, we offer various ways to define excess. There is no single, agreed definition of excess consumption.
Our research suggested that definitions that include objective measures seem to be the most justifiable, while the fairest definitions incorporate a reduction of consumption where this does not cause harm, and where consumption by one group or individual does not restrict the ability of others to fulfil their basic needs.
Public debate on fair and sustainable consumption is likely to be needed to establish the acceptability of any policies that target excess consumption.
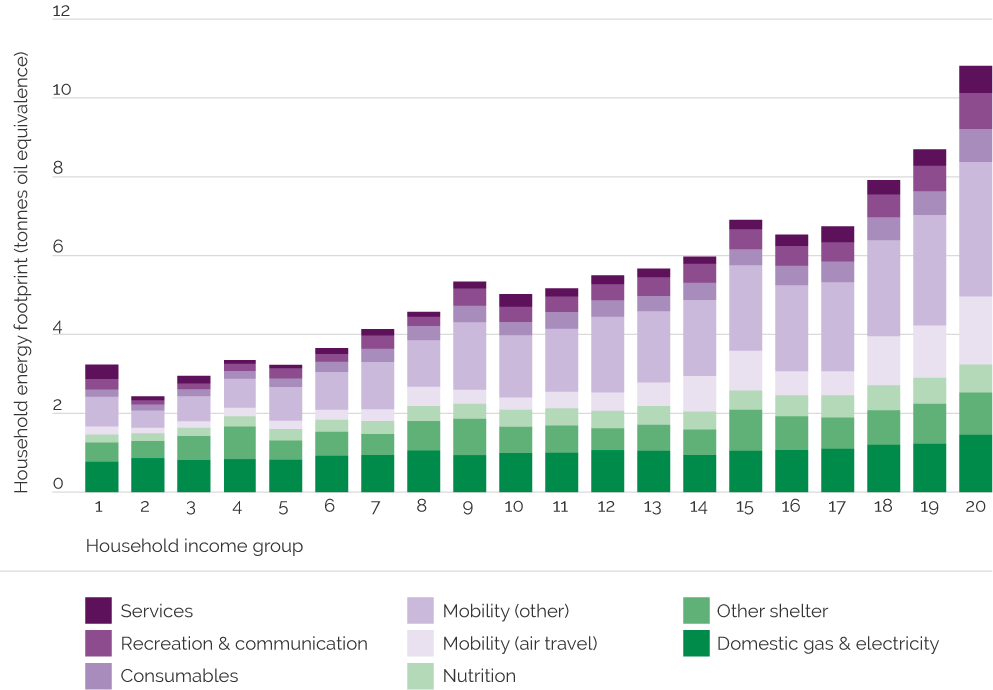
Image description
Block graphs shows small differences in household spending on domestic gas and electricity, other shelter and nutrition across UK income groups. Differences in the amount households spend on mobility (particularly air travel), consumables and recreation increase as the level of income rises.
Why is excess energy consumption important?
Concepts of excessive consumption should matter very much to policymakers. The massive shift in household energy consumption that is required by the UK’s goal of net-zero carbon by 2050 (BEIS, 2019) means that substantial changes in the energy supply mix, the built environment, the energy efficiency of devices, and lifestyles themselves are all necessary (Barrett et al, 2021).
The very sense of excess consumption implies that we should target this excess first to reduce overall energy demand. It is also likely to be fairer to get people to curb these excesses then to expect everyone to reduce their energy use to an equal extent, so this is also an opportunity to address important social justice issues such as energy and transport poverty (Mattioli et al, 2017).
Thus, it would be fairer and more efficient to ask households and individuals whose energy consumption is highest to make the greatest reductions in demand. They have the greatest scope for energy savings, compared to average or low consumption households, and their socio-economic characteristics suggest that they also have the capacity to invest to improve their energy efficiency.
Our research helps to define what is meant by excess and how this is helpful in considering policy options. It also identifies what high-end energy consumers make of policies designed to curb their energy use.
Defining excess
During our research ten distinct, if related, definitions emerged – six are quantitative and four more qualitative. In the table and text below we explain these definitions and the issues or implications that arise from them. Further explanation of some of these definitions is also given in a paper presented at the eceee Summer Study 2021 (Cass, 2021).
| Data type | Definition of ‘excess’ consumption | Issues and implications |
|---|---|---|
| Quantitative | Top percentage | Popularly understood (e.g. the 1%), but the choice of what we consider to be the top proportion is (seen as being) set in an arbitrary way e.g. 1%, 5%, 10%, etc. |
| Above a cut-off or ration | Can be linked to e.g. averages, but cut off points can be (seen as) arbitrarily set, as above. | |
| …defined by global carbon budgets | Links cut-offs or rations to avoiding climate damage. Not (seen as) arbitrary, as targets are set based on scientific evidence of climate limits. | |
| Outliers or extremes | Useful for targeting undeniable excess, statistically simple, but significant overall levels of reduction will likely not be achieved. | |
| Statistical definition | Has an internal logic, but still (seen as) arbitrary depending on the data and statistical model used | |
| Above average | Simple, but conceptually too broad to be achievable as averages are highly variable. | |
| Qualitative | Above what is necessary | Minimum standards (e.g. Minimum Income Standards) have historically and empirically been based on (consensual, contextual, and upwards-ratcheting) definitions of minimum need. |
| Wants not needs | Difficult to distinguish between wants and needs? Potentially resolved by definition of avoid harm over utility. An upper limit of ‘generalisability over relevant population’ may also apply. | |
| Globally generalisable needs satisfaction | Assumes relevant population is global, and therefore that needs satisfaction requiring more than a strictly equal per capita share of global carbon budgets is unfair/damaging. | |
| Unreasonably high | Decided by deliberation, or principles of deliberative democracy. May still be seen as too contextual, relative or subjective. |
Quantitative definitions
1. Top percentage
This refers to the proportions of households who consume the most gas and/or electricity, and/or the top percentage of people who drive or fly the most in a given year. Such a definition has popular currency in discussions of the consumption practices of the elite, for example the idea of ‘the 99%’, and therefore of the ‘richest 1%’.
In our project, data from a number of national surveys was used to identify the characteristics associated with individuals who were responsible for the top 1, 5, 10, and 20% of consumption in a number of areas (e.g. miles driven (Lucas et al, 2022), home energy use, or all energy use) (Buchs et al.). The choice of which percentage to consider as excess can be seen as fairly arbitrary (e.g. 1%, 5%, 10%, 15% and 20% were all used in these analyses). It is also hard to imagine how policy might target some high-end energy consumers and not others, particularly as the definition does not consider individual/household circumstances. Targeting would be possible, perhaps by applying charges retrospectively to a determined level of excessive consumption, but this would not facilitate planning and might be considered a stealth tax.
2. Above a cut-off or ration…
We also modelled the impacts of applying policy interventions to reduce levels of consumption. For example, we considered how much mileage would be eradicated if a cut-off limit was imposed. Our analysis found that a ‘ration’ of 20,000 car miles per annum (in England) would reduce mean car mileage by 9%, and rations of 15,000 or 11,000 miles would reduce mileages driven by 15% or 24% respectively. Potential definitions of excess consumption thus emerged from these analyses, rather than being an input. Unpublished research by the team carried out similar exercises based on a goal of reducing other forms of energy consumption.
This definition of excess consumption seems similarly arbitrary to the first, although perhaps easier to justify, on the basis of its link to objectives of specific levels of energy reduction.
3. …defined by global carbon budgets
Another approach could be to define personal rations based on global carbon budgets such as those calculated by the IPCC (Inter-Governmental Panel on Climate Change). This could be on a global per capita basis (see Andersen, 2018 for an explanation of per capita carbon budgets based on the IPCC’s figures.), or could take account of historical emissions. This would result in a lower than average global per capita allocation for people in developed economies like the UK (see Newell et al, 2021 which distinguishes suggested carbon budgets by historical responsibility).
This is a formula in which excess is defined as those consumption patterns that must be avoided, if target levels of reductions are to be achieved, to increase the chance for humanity to stay within safe boundaries that allow liveability on the planet. It does, however, result in an extremely restrictive definition of excess consumption, including almost all energy consumption in everyday life in developed countries: for example, the Cambridge Sustainability Commission (Cambridge Sustainability Commissions, 2021) concludes that “the richest 1% of the global population needs to reduce their emissions by a factor of at least 30 by 2030”. This is unlikely to be politically or publicly popular. CREDS’ Positive Low Energy Futures Report (Barrett et al, 2021) does however suggest that we can reduce UK energy use to below the current global average, while maintaining quality of life for all.
4. Outliers and extremes
These are the small number of consumers whose annual mileage or domestic energy use is extreme by comparison to the majority. In the team’s analysis of UK high emitters of greenhouse gases through home energy, travel energy, food, and other consumption, the top and bottom 1% of outliers in the sample were excluded, for data quality reasons (most expenditure surveys rely on consumption diaries that are only kept for short periods of time, resulting in the “infrequency of purchase problem” that some people note a very high expenditure because they are stocking up while some people do not note an expenditure even though they are still using up stocks. This can bias distributional analysis). Defining excess as comprising such outliers would be statistically simple, but targeting excessive energy consumption in this way would not make significant reductions, either because of the small total amount of consumption targeted, or the intervention-avoidance of the super-rich who probably make up such outlying data.
5. A statistical definition
Project discussions also raised the existence of purely statistical definitions that could be used to define excess, based on the statistical concept of deviation from a distribution around the median. For example, the definition proposed by one of our researchers was that of ‘that proportion of consumption above a line drawn greater than the third quartile plus 1.5 times the interquartile range (IQR)’ (a commonly used statistical rule of thumb, see Upton and Cook, 1996). Such definitions would be in a sense objective (although their definition is still a matter of choice), but would remain difficult to explain to the public, relying on understanding of statistical concepts.
6. Above average
Our final quantitative definition simply considered excess as ‘that which is above average’. In terms of the drastic reductions required in domestic and travel-related energy consumption, this could make sense from the perspective of serious policy interventions, but may still not be sufficient to reach net-zero goals. Furthermore, given the complex nature of differences in energy consumption relating to different needs and other justifications between different individuals, households and groups, determining and targeting ‘above averages’ might be prohibitively complex, or difficult to justify, given that higher than average per capita energy use might be due to known vulnerabilities, e.g. poor housing conditions or the multiple travel activity demands of lone parents. In other words, this approach would unfairly impact those in energy or transport poverty.
Qualitative definitions
These definitions largely turn on the intrinsic meaning of ‘excess’ as a comparison with need.
1. Above what is ‘minimally necessary’
Here we considered a concept of excess as being whatever consumption exceeds e.g. “a minimum acceptable standard… rooted in social consensus about the goods and services that everyone in modern Britain should be able to afford” (Bradshaw et al. 2008: 3). This concept relies on a consensual definition of need (such as the Minimum Income Standard) which is relative to society and contemporary conventions. It involves defining excess as consumption that goes beyond a consensual, societally relative definition of minimum needs. However, it should be remembered that such needs rise over time, as new goods or services become locked in to society’s definition of what is minimally acceptable (see Shove (2003) on how society’s needs ‘ratchet’ upwards, or Brand-Correa and colleagues’ paper on the ‘needs satisfier escalator’, Brand-Correa et al, 2020). Efficiency gains may meet energy service requirements with less energy, but the number, variety, and size of energy service needs themselves outstrip these savings.
2. Needs not wants
A similar concept involves drawing a distinction with consumption which fulfils basic needs, whereby excess is represented as going beyond meeting this need, e.g. simply to increase general well-being.
A key distinction that has been offered is that a decline of well-being-based consumption “might result in subjective discomfort at loss of convenience or social status, but does not result in increased physical or mental harm, or in the decrease of a person’s ability to participate meaningfully in their society” (Brand-Correa et al, 2020), unlike declines in consumption for genuinely basic needs. Existing research in this area has drawn a distinction between needs and societally specific “intermediate needs” (Doyal and Gough, 1984; Doyal and Gough, 1991) and “satisfiers” (Max-Neef, 1991; Ekins and Max-Neef, 1992) through which needs are pursued and secured in any one specific society. These, unlike basic human needs, are highly variable and socially or culturally specific; satisfying an individual’s needs for well-being in specific ways could also mean frustrating others’ ability to satisfy their basic needs.
How then would it be possible to define what energy consumption is satisfying (basic) needs and what is satisfying wants, in the context of energy consumption reductions for climate change mitigation? Difficulties arise in the practical application of this concept (although the Sustainable Development Goals are one attempt, globally), for example, within unequal societies, where the poorest are unable to fulfil their basic needs despite the resources required being available to others. In addition, to draw a line between societies is problematic, whether these are thought of geographically (comparing the luxury of the developed world and the poverty of the developing) or temporally (between the current consumer society, and the climate-chaos impacts of the future).
3. Globally generalisable needs satisfaction
Another approach is to combine a definition of sustainable development, i.e. where others and people in the future have equal rights to enjoy the environment, with ‘maxims of action’ (this phrase is taken from Kant’s Categorical Imperative. It means an abstracted rule of behaviour). which can be generalised to everyone fairly (these arguments are fully explored in Cass (2021)). This definition suggests that energy-consuming behaviour is excessive if the means through which individuals in contemporary, developed societies pursue well-being and extended or intermediate needs cannot be enjoyed by everyone on earth without the serious intergenerational inequity of damage to the climate.
Such a definition would set the level of reasonably generalisable energy consumption close to the globally equal shares of the planet’s remaining carbon budget, which according to IGES et al. (2019) must reduce to “approximately 2.5 tonnes of greenhouse gas emissions by 2030 [per person], and 0.7 tonnes per person by 2050, if not sooner” (Cambridge Sustainability Commissions, 2021). These carbon budgets reflect levels of energy consumption for needs satisfaction, above which consumption could be considered excess. Given the variety of household energy consumption represented here, the majority of everyday life energy consumption in the UK again can be considered excessive.
4. Unreasonably high
Our definition of unreasonable excess could be founded on such debates of what is a fair energy budget for a household, but it raises the idea that excess, like need, can be based on consensual definition.
On this account, excess is whatever people can agree it is, based on ideas of ‘fairness’ and ‘just’ levels of consumption that can be rationalised, defended, and justified to others; perhaps especially to those who are affected by tackling it.
Most importantly, this definition acknowledges that any policies that are used to target excess consumption and excessive consumers must be similarly reasonable and justifiable, based on the principles of deliberative democracy and exploring options, impacts, and fairness with members of the public. Such a definition lies at least partly behind our project’s series of deliberative workshops.
Conclusion and recommendations
In conclusion, no one definition of ‘excess consumption’ can be objectively established, and different definitions may be considered more appropriate in different contexts. However, the definitions that seem to be most justifiable are those tied to objective measures, such as the limits imposed by target reductions of carbon to avoid significant climate change (quantitative definitions 2 and 3, qualitative definition 3), and the fairest would appear to be those that both single out the consumption of those who could easily reduce without harm (as in qualitative definition 2), and similarly whose consumption affects the ability of others, including those in the future, to fulfil their basic needs (quantitative definitions 2 and 3, qualitative definition 3).
In terms of policymakers justifying specific measures based on definitions of excess consumption, qualitative definition 4 comes to the fore, arguing for the need for the public to be involved in discussing policy options to secure acceptability.
Methodology
For the quantitative definitions, we used various national datasets and analytical and modelling approaches to try to understand who excess consumers are, what social characteristics they share and where they are more concentrated geographically. Findings are reported in Section 2. Sometimes proxy indicators stood in for energy consumption; for example car and public transport mileages reported in the National Travel Survey, and average combined or separate utility bills, or gas and electricity consumption data.
For the qualitative definitions, we interviewed 30 individuals who lived in high-end energy use households to explore the reasons and motivations for their consumption patterns, reported in Section 3. These households were recruited based on our quantitative data analyses by targeting a small number of census Lower Super Output Areas (LSOAs) containing a large proportion of households we identified as high energy consumers through their high monthly utility bills, car mileages, and numbers of annual flights. We also held four deliberative workshops with a total of 31 participants who live in a range of high and low energy-consuming households to explore what they would consider as a fair approach to energy reduction, reported in Section 4.
Section 2: Who is consuming excess energy?
In this section we focus on the data analysis conducted to identify the demographic groups with the highest energy consumption.
To meet the UK’s target of net-zero carbon emissions by 2050, household energy use in buildings and transport has to reduce through energy efficiency measures and by changing how we travel, and also through behavioural or lifestyle changes to consume and travel less. This energy demand reduction (CREDS has made the case for energy demand reduction in its report, The role of energy demand reduction in achieving net-zero in the UK (Barrett et al, 2021)) must happen at the same time as accelerating the adoption of affordable clean technologies, managing the effects on demand of changing labour markets, overseeing the growth of on-demand mobility services, increasing digital connectivity, and ensuring that energy supply is de-carbonised.
Households that use a disproportionately large amount of energy have the potential to make the biggest reductions in energy use and carbon emissions. We believe that targeting them could be an opportunity to make significant reductions in a way that is fair and targets those with the greatest capacity to make changes.
The research team took data about household energy use to identify the places and people with disproportionately high levels of energy consumption in their homes and personal travel. Our main findings are below. Subsequently, our analysis was combined with evidence from interviews and workshops with the general public to provide a more detailed picture, covered in this section and Section 3.
Summary: key findings
Our data analysis concludes that:
- In common with other studies, we found that high household income is a major factor in high-end energy consumption.
- Transport energy use in particular is much higher amongst the richest income groups. The wealthiest 10% is responsible for 25% of all personal transport emissions and for 41% of all flights from the UK.
- Just 11% of the population in England accounts for nearly 44% of total car mileage. The top 5% of drivers travel nearly 27,500 miles per person per year: more than 4 times the average for drivers in England.
- Not all individuals in the top 20% mileage group are high earners. However professionals driving on long business and leisure trips account for the largest proportion of this high mileage.
- The top 20% of households by income are responsible for nearly 31% of all domestic energy consumption. These wealthier households tend to have larger homes that need more energy to heat and run. They also often live in suburban and rural areas and need to drive to access work, shops, services and social activities.
- These findings provide a background for designing equitable routes to radical energy reductions in the context of the UK’s net-zero delivering targets for 2050.
Richer households generally consume more energy
A recent evidence review for the Cambridge Sustainability Commission (Newell et al, 2021) has highlighted that income is a major driver of direct and indirect domestic energy use (gas and electricity) and related carbon emissions. The combined emissions of the richest 1% of the global population account for more emissions than the poorest 50%. Richer households and individuals consume more energy overall even if controlled for household size, age, gender, education, employment status, ethnicity, and rural/urban location. Other key drivers of energy use, such as car ownership and house size, are also highly correlated with income.
In the UK too, high income households dominate household energy use. When we look at total household emissions that include those embedded in the consumption of food, clothing and all other goods and services, households in the UK whose incomes are in the lowest 20% generate just 11% of total household emissions, while households in the top 20% of incomes contribute nearly 31%. Figure 2 highlights the relative differences in domestic energy use between income brackets and between energy types in England (decile 1 = the lowest income group).
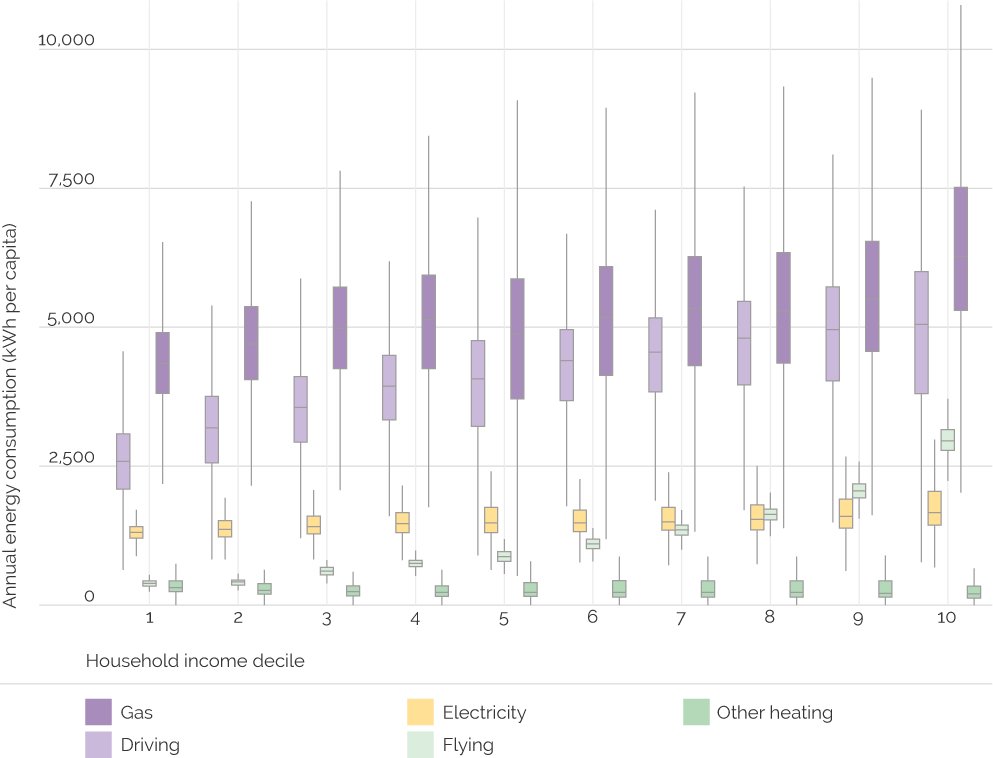
Image description
Box and whisker plots show the annual amount of energy consumed per capita by different activities and in different household income groups. The amount of electricity used only increases slightly between the 10 income groups, averaging around 1250 kWh per capita. Other heating also remains fairly steady, averaging around 250 kWh per person. Energy consumption of flights increases notably the higher household income is, ranging from around 300 kWh per person in decile 1 to over 2,500 kWh in decile 10. Driving consumes a great deal of energy and also increases with household income – from an average of around 2,500 kWh per person in decile 1 to over 5,000 kWh in decile 10. Most energy is used for gas, largely heating, with an average of around 4,000 kWh per person in decile 1, increasing to an average of over 6,000 kWh per person per year in decile 10.
The UK has made some progress in decarbonising electricity supply, but this figure highlights that electricity (yellow boxes) is only a small proportion of total household energy use.
If and when the UK’s policy objectives to electrify both car travel and home heating advance, this proportion will rise, but it will also simply transfer emissions to the generation sector unless the sources of electricity are decarbonised. In fuel energy used for personal transport, the UK has made no progress since 1990, which, combined with a shift to diesel and to larger cars and engines, has outstripped engine efficiency gains, meaning that greenhouse gas emissions in this area have risen by 6% 1990–2017 (ONS, 2019).
Figure 2 also highlights the significant variation in transport energy use even within income deciles. This is important as it shows that high energy use is not an inevitable outcome of high income. Some low-income households also have high levels of energy consumption, largely due to poorly insulated homes, and this can lead to energy poverty. In general, given that home energy use is more consistent across income differences, low income homes spend a higher proportion of their income on home heating, meaning that policy measures that add environmental taxes to home energy are regressive (Barrett et al, 2018).
Our main message here, is that it would be both more effective and equitable to curb high-end consumption and consumption of luxury items such as flights than to target necessities across the whole income spectrum. High-income, high-consumption households have access to resources to reduce grid energy consumption by purchasing technologies, such as heat pumps, solar panels, and to decarbonise by purchasing electric vehicles. However, households that have low incomes will need to be identified and supported to use these technologies. Of course, to decarbonise all household energy use, a blanket measure of providing energy saving technologies to all those who cannot afford them would be more effective, but much more expensive.
Excess in travel and mobility
Transport energy consumption in particular is highest amongst the richest 20% income groups: the lowest 20% income group contributes only 8% of transport emissions, while the highest household income group is responsible for 25% (Based on our own analysis of the National Travel Survey, which collects data only for England).
Air travel
Domestic transport (including domestic flights) contributes nearly 40% of total energy demand and 27% of the UK’s GHG emissions (BEIS, 2019; CCC, 2018). Air travel is especially unequally distributed across the different income groups. For instance, in the UK just 17% of households in the lowest income group have at least one roundtrip leisure flight per year, while slightly more than 72% of households in the highest income group have at least one flight per year (see figure 3) (Based on our own analysis of the Living Cost and Food Survey, which is a sample survey for the whole of the UK).
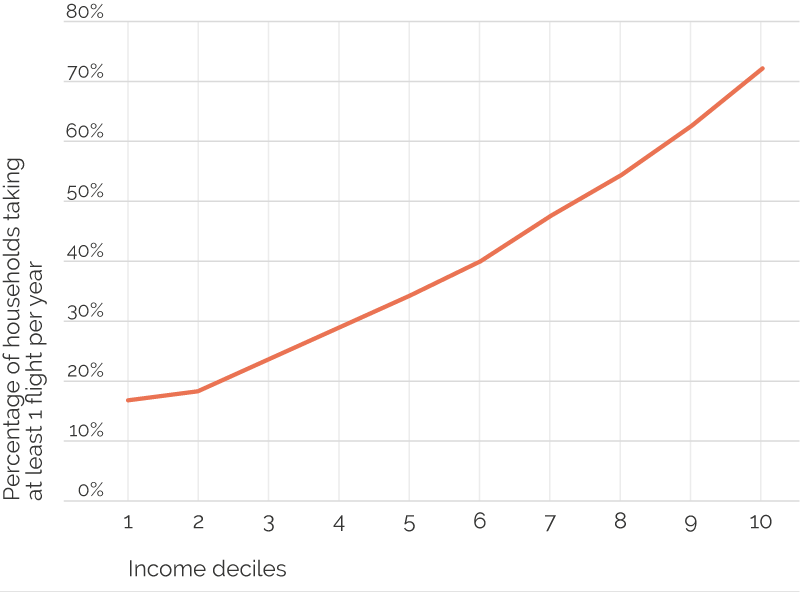
Image description
Line graph shows the percentage of households that take at least one flight per year for leisure increases from around 18% in decile 1 to over 70% of households in decile 10.
The UK bottom income quintile (5th) is responsible for only 6% of all annual flights, while the top income quintile (5th) is responsible for 42% (Büchs and Mattioli, 2021).
Since air travel is so unequally distributed in society, any increase in aviation costs would be progressive in the sense of impacting those with more wealth. From that perspective, it seems socially unjust that aviation fuel remains untaxed, compared to domestic or motor fuels. However, higher aviation costs would still have an impact on the infrequent flights of the less wealthy. A frequent flyer tax would have more progressive and fairer distributional impacts: it would put a higher financial burden relative to income on richer people than on poorer people, as shown in Figure 4. Families taking a once-a-year break in the sun wouldn’t be adversely affected, but people flying more often would see the tax applied after their first return trip.
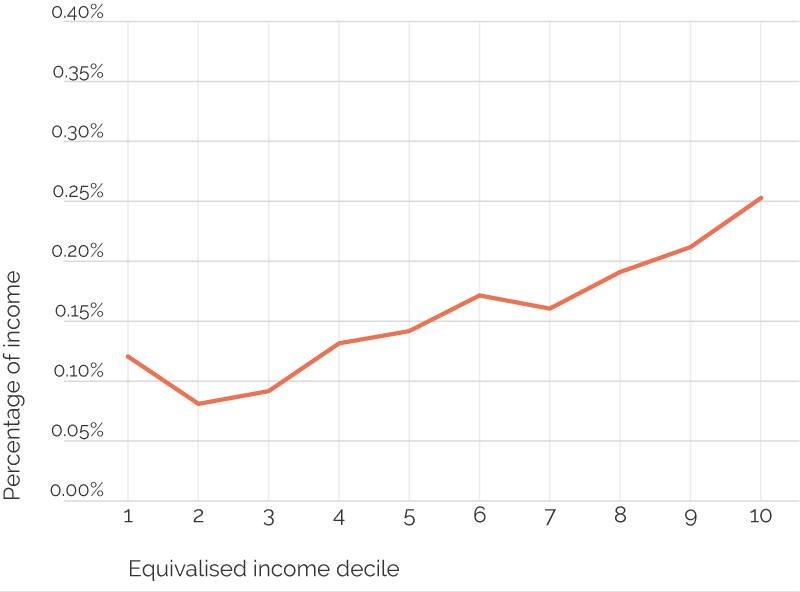
Image description
Line graph shows the proportion of household income a frequent flight tax for the UK would represent. In decile 1, 0.12%; decile 2, 0.08%, decile 3, 0.09%, decile 4, 0.13%; decile 5, 0.14%; decile 6, 0.17%; decile 7, 0.16%; decile 8, 0.19%; decile 9, 0.21%, decile 10, 0.25%.
Car travel
Our study identifies that car use varies significantly by income. In 2018 people in the lowest income decile drove an average of 3,948km per person per year by car. People in the richest decile drove an average of 7,364 km per person per year (Figures from the Place-Based Carbon Calculator).
Figure 5 shows that overall, 11% of the UK population accounts for nearly 44% of total car mileage. The top 5% of drivers cover nearly 30,000 miles per person per year.
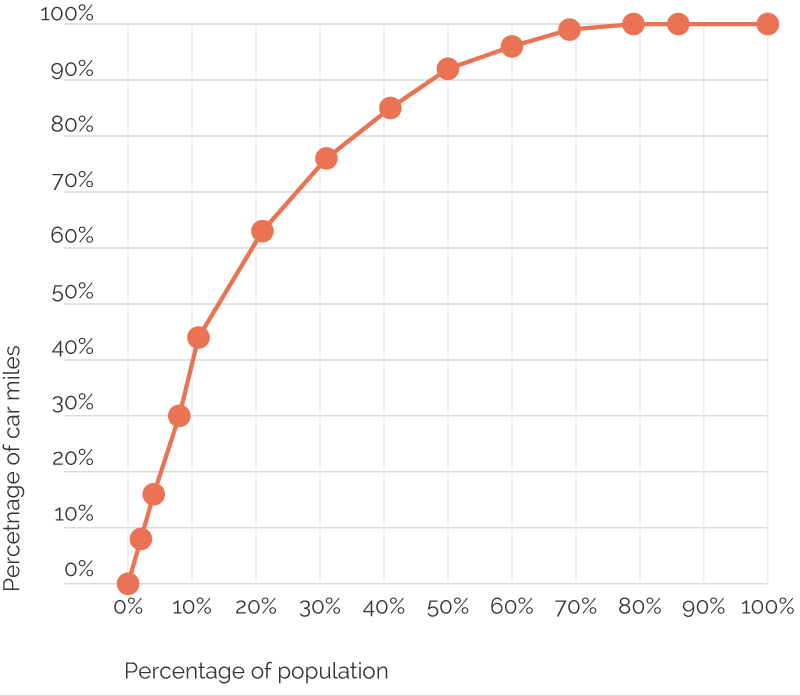
Image description
Line graph shows that 30% of car miles are driven by less than 8% of the population, with 44% of car miles driven by 10% of the population. Over 90% of car miles are driven by 50% of the population.
These high-mileage travellers are disproportionally concentrated in richer households. This aligns with previous research, which suggests that only 20% of the population, mainly from affluent households, are responsible for nearly 60% of local transport emissions (Brand and Preston, 2010).
Apart from having high incomes, these high-mileage car drivers are disproportionately (male) full-time workers, many of whom commute long distances for work using company cars.
While personal choice and lifestyle play an important role in domestic travel, external factors such as local urban form and level of access to services (shops, health facilities etc.) have also become significant factors in shaping domestic transport consumption behaviour (Lucas, 2009; Lucas et al, 2019; Mattioli and Adeel, 2021).
There will need to be change in both personal behaviours and in policy choices if lower-consumption lifestyles are to be made possible and desirable. Getting these high-mileage travellers to reduce their overall travel consumption and to use low-carbon transport options, such as public transport, cycling and walking will be essential if the UK is to achieve its carbon emissions reduction targets (Brand et al, 2020).
Excess in domestic energy use
Energy use is more evenly distributed for home energy consumption (electricity, gas and other heating fuels) than for transport use: the poorest fifth of households contributes 16% of all emissions, while the wealthiest fifth is responsible for 25% of household emissions. These wealthier householders could take the lead to introduce energy efficiency in the home, but conversely they have little incentive to reduce their energy use because they can afford the higher fuel expenditure. The policy measures required to target higher domestic energy consumption (principally for heating) are probably better focused on absolute levels and on blanket reductions, rather than attempting to target overlaps with income. Means-testing financial support for e.g. insulation or air source heat is necessary to support those in fuel poverty, but it also removes the incentive for the wealthiest, who were resistant to investing without a preferential Return-On-Investment being guaranteed through government support, when this was explored in our interviews and workshops (see Section 3 and Section 4).
Spatial patterns in combined domestic and travel energy consumption
Figure 6 highlights the spatial variation in household energy consumption by showing the average total energy use (per person rather than per household) for each Lower Super Output Area (LSOA) in England and Wales. It combines five types of energy use: gas, electricity, non-gas/electricity heating, car driving; and flights for each LSOA. Several clear patterns have emerged from the spatial analysis. Firstly, the wealthiest neighbourhoods are often the highest energy-consuming areas, supporting previous findings on the links between higher income and higher energy use. Secondly, energy consumption is higher in suburban and rural areas, particularly when there is poor access to public transport or in neighbourhoods with larger homes.
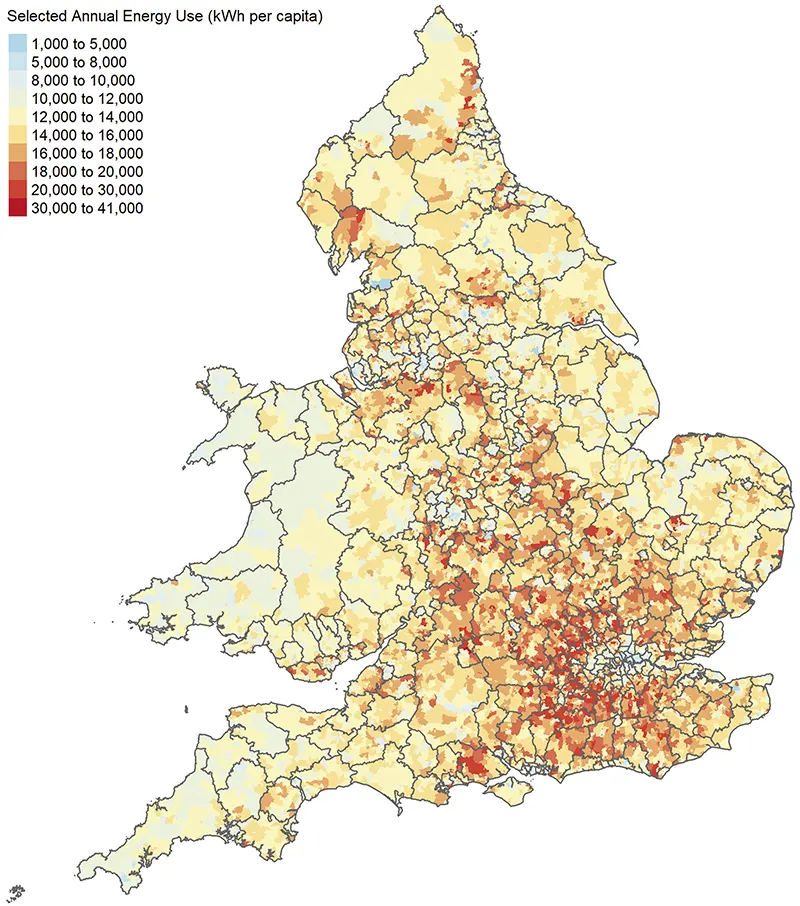
Image description
Map of England and Wales shows average total energy use (per person rather than per household) for each Lower Super Output Area (LSOA) in England and Wales. Areas where the highest energy users are located are largely clustered around the south east of England (outside London), with a corridor of high energy use LSOAs heading north and west, a small group of high energy areas in the north east and a small cluster in the south of Wales. The centre and east of London shows areas of low energy use, with large parts of Wales and the south west of England also using less energy.
A more in-depth analysis of the spatial data is available as an interactive web tool, the CREDS Place-Based Carbon Calculator (Morgan et al, 2021). This is designed to help local authorities identify the areas where overall household energy consumption is high to assist prioritisation of their net-zero action plans. There is a strong relationship between LSOA area classification and energy use which could be used to guide national and local policy to reduce high-end household energy consumption. The Place-based Carbon Calculator can help policymakers to understand these relationships and plan their local carbon reduction strategies accordingly.
Data issues
In conducting these various analyses, a number of limitations of the available data have become clear. These give rise to the following recommendations about the accessibility of data that, if attended to, could improve the analysis of excess consumption and help to target those responsible.
- Spatially disaggregated (e.g. LSOA) and annually updated household income data. This should be possible to generate from tax data, and as income is an underlying factor for so many things, good income data would help with many types of research.
- Better access to MOT data and registered keeper data. This would make it possible to create a long time series of spatially disaggregated data about where cars are and how they are used. This would help with transport planning and understanding why car use varies so much across the UK.
- Improved access to public transport data: while much data exists, it is variable in quality.
- Improved data about housing and neighbourhoods e.g. the provision of off-road parking for planning EV charging networks.
- Early academic access to census data should be allowed. At present, a year can elapse before full access to data at the wards level, and up to 5 years before analysis at OA level is possible.
Section 3: How do high energy households view their consumption?
We interviewed 30 householders whose domestic and travel-related energy consumption is (sometimes substantially) higher than average to hear about their lifestyles, and the ways in which their homes, appliances, vehicles, and every-day and occasional activities together contribute to their high energy consumption.
Why do these households consume so much energy and generate high emissions?
The main factors that drive these ‘lifestyle’ emissions, due to domestic and travel-related energy consumption, are: flights and car-based travel, domestic space heating, and diet and goods. Previous analysis of lifestyle emissions has demonstrated that the additional energy consumption of more wealthy households is largely made up of increases in mobility rather than increases in e.g. household energy services. Figure 7 demonstrates the strong sample of high consuming households achieved.
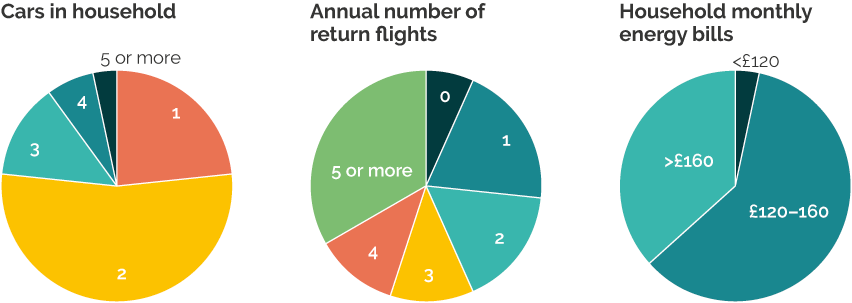
Image description
Pie charts showing: Number of cars per household – 1 car in 7 households, 2 cars in 16 households, 3 cars in 4 households, 4 cars in 2 households and 5 or more cars in 1 household. Annual number of return flights – 0 flights by 2 households, 1 flight by 6 households, 2 flights by 5 households, 3 flights by 3.5 households, 4 flights by 3.5 households, 5 or more flights by 10 households. Household monthly energy bills – less than £120 per month in 1 household, between £120 and £160 per month in 18 households, more than £160 per month in 11 households.
Domestic energy
In our interviews, we asked the participants to describe their homes, room by room, and also their location, the sort of area they live in, and their outdoor spaces. In this way, we tried to cover all of the systems, devices and appliances, and other aspects of everyday life that might generate energy demand.
Here we offer some of the common factors that we found, and some extremes, across all aspects of high domestic energy consumption, along with some data from the interviews for illustration.
Homes
House size and age can affect demand for heating, a major source of domestic energy consumption. Our recruitment criteria aimed to avoid the oldest properties, as we were more interested in high energy consumption through issues other than having an old, draughty house, although four interviewees were in houses built pre-1930. Those in old houses and/or without double-glazing mentioned the coldness of their homes:
“So the house is about 130 years old, it’s a five bedroomed, large, period, detached house, and it’s freezing, right? …we don’t have double glazing; it’s draughty; we don’t have insulation in the roof or in the walls.”
Most homes in our sample were double glazed, and several had extensions or kitchens with patio doors, and these were mentioned as being harder to heat. Interviewees often lived in homes over three floors, and almost all had between three and six bedrooms and multiple bathrooms and en-suites.
Some had outbuildings, including one swimming pool with an attached flat. Although all interviewees had gas central heating systems, many had additional heating/cooling/AC systems installed, including e.g. two separate systems of boilers, piping, and hot water storage, or with electric fires, log-burner/multi-fuel stoves, Agas, and other sources. Most mentioned that they had insulation in their lofts. Most had thermostats, and some had smart heating systems or zone heating. All these levels of control still seemed to result in large bills, which raises the possibilities that they were paying too much for their energy, or were perhaps heating their homes to higher temperatures, despite many of them claiming the opposite:
“I don’t think there are many ways that could be more frugal than we are. I mean, don’t think we are sitting here shivering, we are certainly not that, we are comfortable but not excessively warm.”
Appliances
Although appliances are less important, in total energy consumption terms, than space heating/cooling, there was plenty of evidence that households had multiples of different appliances, including ICT and entertainment devices (TVs, laptops and PCs, screens, pads/tablets, smartphones), home office equipment (printers and scanners, double screens) used for working from home, and kitchen equipment, with more than one oven being common, along with 5–ring hobs, and multiple (fridge-)freezers, with numerous references made to ‘American-style’ fridges. Coffee-makers, food processors and juicers were also common along with air-fryers and wine-coolers.
Less interesting than the detail of the appliances is thinking about where the ‘need’ to have these things comes from. In some instances, it seemed that the dominant influence was media along with seeing such arrangements at work in office environments, or in restaurants:
“Well, we have three desktop computers, my wife has one, I have two… then we have a couple of laptop type things… we’ve got a printer each and obviously scanning.”
Frequent laundry – including an avoidance of ‘eco-settings’- tumble-drying and daily use of a dishwasher were other high energy uses, along with hoovering. These are practices of cleanliness that barely register in most energy demand research, and yet they utilise high-energy devices. We observed a gender-based difference in personal care, where females in the sample households regularly took baths, while males took showers. For some, this was viewed as one of the most wasteful behaviours they took part in, but also as being not costly enough to be concerned about:
“From a cash point of view, I don’t have to worry about the fact that my daughter and my wife want a bath every day. You know, I don’t have to worry about the fact that if it’s a bit cold, that we put the heating on or they leave lights on… Now how that effects the environment – that’s a different thing.”
This example of a focus on low-impact behaviours over high-impact ones is discussed under Normalising high consumption through discourse.
Travel-related energy
Our questions asked about all regular (e.g. weekly) and irregular trips made by our interviewees and their families. Analysis of the data reveals that cars dominated all trip purposes with the exceptions of ‘trips away with work’, holidays and ‘getaways and weekends’ where air travel was also common. Train travel was less used, mostly for work (mostly commuting) and some trips away with work, and walking and cycling were mainly mentioned in regard to sport and recreation (i.e. exercise), with walking also being associated with other short-distance travel such as visiting friends and family, some food shopping, and school runs.
A third of our sample drove more than 15,000 miles a year, which our research (see Section 2) has shown puts them in the top 8% of car travellers. While 50% of people in the UK do not fly in an average year, 93% of our sample flew at least once annually (compared to 72% of the top income quintile across the UK), and a third flew 10 or more return flights, making them representative of the ‘hyper-aero-mobile’ (Cass, 2021). For context, in the UK 15% of fliers take 70% of the flights, and globally 1% of the population is responsible for 50% of passenger flight-related emissions (Gössling and Humpe, 2020).
Cars and driving
Nearly a quarter of our sample had three or more cars, with one interviewee having four cars including a vintage vehicle, while another had six cars including one kept abroad at a second home. These extremes highlight perhaps the symbolic importance of cars to some, as they could not all be used frequently for driving. The majority of the sample drove to work, particularly because their work required travel to multiple sites for face-to-face interactions.
This reflected the (affluent) employment categories of interviewees, for example management (requiring visits to different offices), engineering (sometimes requiring visits to work sites, or carrying equipment), sales (requiring visits to customers), and other professions (requiring visits to multiple service sites or to clients).
Work practices and the expectation of face-to-face interaction can be said to drive the need for car use in these cases. In some cases, multiple members of the same house took two cars on near-identical commutes, because of very slightly different working arrangements or leaving times, or a perceived need to be flexible:
“We tended to go in separate cars because we were doing different jobs and obviously [wife] was in charge so she got there early and finished late, and I used to go out to see clients sometimes as well.”
The scope for substituting travel for work with virtual working was highlighted by 27 out of 30 interviewees talking about working from home during Covid restrictions (Lokesh and Marsden, 2021).
One interviewee cited two cars being used for a variety of short distance trips, including: commuting to park at a tube station (10 minutes); driving to meals (5-10 minutes); visiting parents-in-law (less than 15 minutes); and going to the gym (“Gym is local. Gym is 10 minutes’ drive from me … I would use gym three times a week.”)
In terms of other trips, well-known reasons for car-use were cited, including speed and convenience in contrast to public transport, the lack of availability of alternatives, the travel demands associated with parenting, and the lack of fit of work/school/post-school activity times (Cass and Faulconbridge, 2016). Cars were used for other trips such as long-distance travel for weekends, getaways, and visiting friends and family, because of their ready availability, as well as their cargo function and room for children.
Flights
The participants revealed a huge amount of international flying, much of it for work. This was linked to jobs in the oil and defence industries, property and retail, engineering and consulting.
“I have responsibility for the Benelux, so, you know, flying over once a fortnight to Schiphol or into Brussels, and also probably with work, maybe two or three long hauls a year as well… last year, Shanghai, Buenos Aires. The year before, Dubai, New York. So, you know, I was trying to think today, I probably take, with holidays as well, maybe 60 flights a year.”
People would also revisit these countries or locations for holidays.
“Travelled a lot to South Africa for work, and also on holiday to South Africa. US a lot for work, also US for holidays as well, you know, Miami a couple of times, the Quays for holidays as well.”
Holidays were frequently three to six times a year, to Europe or further afield, and often involved visiting their own or friends or families’ properties:
“We generally go on three international holidays a year as well and fly… my parents-in-law have a villa in the south of France, so we go there every year for two, three weeks, and that’s a flight to Nice.”
Some holidays focused on specific ‘bucket lists’ of unique experiences, such as a cruise to an Alaskan glacier, a helicopter trip to have a champagne breakfast at the Grand Canyon, or a tiger-photography trip to India. Some of the trips we heard about were impulsive, such as a four-day holiday to Thailand and a four-day yoga retreat in Columbia, taken by the same interviewee who had a travel agent friend who would book them same-day flights. Some displayed awareness of the environmental impact – “I’d hate to think of my carbon footprint [laughter]” – but others described taking at least three international holidays a year without any sense of this being unusual.
Destinations differed between people who took routine and regular visits to properties abroad (ski chalets in Norway and the Alps, villas in the north and south of France and Portugal, an apartment in Madeira), those who preferred more traditional e.g. European beach holidays, and others who were interested in novelty, city breaks, or visiting “parts of the world you only read [about] or see on the television”, such as “Greenland, Iceland, Norway, Russia”.
Drivers of energy consumption: a qualitative analysis
In the following sections, a more qualitative approach is taken to analysis, trying to understand the drivers behind high-consumption lifestyles.
Modern living kit
The interviewees took for granted that the lifestyles and home set-ups that they described were normal and desirable: frequent foreign holidays, especially to a family villa or apartment, if one could be acquired, is what one should aspire to. They found it unnatural to explain why they had an extension, or underfloor heating, or an L-shaped kitchen-diner with an island, or a five-ring hob, air-fryer, multiple ovens and freezers, because they understood these to be aspects of a desirable lifestyle and living arrangements. Their garden would ‘naturally’ involve AstroTurf, an outside dining table, lighting and heating, because eating outdoors is something that everyone would want to do. One spoke of a wine-cooler as ‘the usual’ thing to have in a garage. Attention to language sometimes betrayed where these impulses came from, for example in talking of open-plan homes and zonal temperature control as modern living. Modernity was also blamed for family members simultaneously watching entertainment in different rooms and for the resulting multiplication of appliances:
“And then upstairs typically we’ve got… so you know what it’s like in a modern house… there are like four or five TVs in the house. Computers: oh my goodness, you don’t want to know; ridiculous.”
Careers in practices (and devices)
Socialisation processes introduced children to electronic devices, from tablets at a young age, to smart phones at age 11, linked to walking to/from a school bus or high school, if they were not driven. Children’s bedrooms or play-rooms were described as transforming into places for them to watch separate entertainment, or as ‘gaming caves’.
A “proper” childhood appeared to be one with constant access to (preferably digital) entertainment: “it’s gone from a toy room when she was a child to a TV room and everything”. In teenage years, as well as an expectation of learning to drive, socialisation and friendships were described as being ‘drive-through’, revealing the multiple influences of norms, the spatial arrangement of localities, the provision of car-dependent facilities, and the perceived importance of speed and convenience.
“That’s the way they tend to live their lives these days, it’s, you know, as quickly as possible and there and back and A and B and you know, ‘I don’t want to catch two buses’ and ‘I’ll go and I’ll pick my friend up and we’ll go to the cinema or go for something to eat or, you know, drive-through McDonalds…’ Everything is drive-through isn’t it now as well?”
Middle class childhood as a key driver?
This raises the question of whether childhood itself should be seen as the process which drives the normalisation of high consumption lifestyles? One aspect is a desire to give children more (chances, opportunities, comfort and entertainment) than the parent experienced: “that’s why I do like travel, because I didn’t do it a lot when I was younger.” This aspirational attitude might then lead to raised expectations in the children, which the parents would sometimes seem to blame them for, while in other cases they acknowledged their influence.
“Because both me and my husband we’ve been good earners so we live in a very affluent area… so [child] mixed with other people… from other backgrounds that are much wealthier. So, [child]’s seen what a good lifestyle is and [child] just perpetuates it.”
In either case, the provision of multiple opportunities often seemed to lead to frenzied timetables of activities in, around and after school, which were largely therefore car-dependent:
“It used to be I did the girls and he did the boys so I’d go netball he’d do rugby so we’d be driving all weekend and we’d never see each other.”
Location and transport networks (and residential choice)
Traditional transport research has identified residential choice as key in determining subsequent travel behaviour. Many of our interviewees had chosen locations for their ‘niceness’ – leafy, quiet, suburban, with similar people, displaying class or wealth distinction. These locations could also be car-dependent.
“It’s surrounded by green belt and woodland. It’s got very easy access to central London by over-ground and underground train and… all my neighbours were professional people and it was just very pleasant… you do need transport to actually get to any shops… it’s not easy to be here unless you have a car …”.
They often had good rail connections, even if these weren’t often used, or proximity to motorways or airports, required for work reasons. Often such residential locations were viewed as a ‘reward’ for having to work in the city, or around the country, thus cementing car-dependent work and leisure. Although most of our older interviewees had remained in one house for most of their careers, younger ones displayed a commitment to a ‘property ladder’ view of homes, improving houses with extensions, making them open-plan, selling and moving, buying second properties for rental income, and ideally buying a foreign property to retire to. This is a property owners’ career in home-owning practices with a clear trajectory, and which involves relocations and eventually flight-inducing foreign travel, as the model of ‘the good life’.
Normalising high consumption through discourse
The presentation of these lifestyles as ‘normal’ is accomplished in numerous ways through the language interviewees use. These discursive strategies are subtly different to discourses of, for example, denying climate change as real, or deploying ‘discourses of delay’ (Lamb et al, 2020; Lamb, 2020), to justify not taking action.
Everyone is an environmentalist (nearly)
Interviewees stated that they were reducing energy use, “as much as possible”. In practice, their actions were limited to e.g. changing lightbulbs and turning off lights. Other interviewees translated mentions of or questions about environment into other discourses. A younger female professional talked about avoiding packaging and fast fashion, while another converted a question about climate change into answers about organic, local food, which was preferred, but difficult to accomplish in the face of ‘convenience’. Male interviewees tended to talk instead about smart technologies, electric vehicles, smart controls, and high-tech solutions including nuclear power, autonomous vehicles, and new homes with PV roof tiles and battery storage.
Separation of consumption areas
The question of lowering consumption was shunted into specific areas: the ideal techno-fixes for new build homes, or else in terms of consumer choices about food, clothing, and make-up. The issue of a separation of areas of consumption is known from the academic literature, especially where holidays are seen as an escape from normal values and consumption behaviours relating to the environment (Barr et al, 2010). Several other cognitive separations were evident. One was the separation of efficiency from numbers of devices: when lighting was LEDs, then it did not seem to matter that one home had 160 of them. Many stated that their domestic devices were A++ efficient, but would use tumble driers and dishwashers daily, or did not use the eco-setting because it was slow:
“It’s got an eco-setting which I just do not use because it’s over three hours… I don’t see the value of that, to me that’s just ridiculous.”
One interviewee with a house in acres of land used firewood in their Aga, and saw their preservation of fruit as part of a frugal lifestyle, but this was accomplished by having multiple freezers.
Discourses justifying reasonableness
Very specific linguistic tricks can be seen as justifying behaviour. One was to characterise circumstances that are properly the result of choices or based on privilege or wealth as ‘luck’ (such as the residential locations chosen or the lack of a need to think about costs), or else as being conditioned and therefore ‘unavoidable’:
“I’m really lucky and I appreciate that, and it means I can live my life comfortably without having to worry about it”; “My wife’s family always had Agas so when we moved here I had no choice, we had to have an Aga”; “you’ve just had no option but to work in London for certain jobs when you live round here… we made a lifestyle choice to live far enough away that you have a bit more space and greenery.”
Motivations for pro-environmental behaviour/change
Considering that voluntary behaviour change based on individual choice is a key approach to policy making on reducing lifestyle emissions or excessive household energy consumption, there was evidence that there was explicit rejection of its efficacy in the sample. Even slight changes in behaviour (recycling was the context of the following comment) were resisted as being out of step with values, or else there was seen to be a ‘tipping point’ where environmental concerns simply lost out to cost or convenience:
“I’m not adverse to change. So, but there has to be a relevant daily reason to do it; not just something that’s completely against my sort of brought up psyche”; “generally I’m… making small changes where I can… the price was just prohibitively high… I don’t want to change my lifestyle to accommodate loads of things… I consider them but… if it’s going to be a massive inconvenience… no.”
Smart meters (i.e. in-home displays) were in almost all of the sample houses, but their information -> behaviour change role was rejected as being “ridiculous” in a context of e.g. baseload and backgrounded consumption.
“Pointless information, I suppose… if it’s £4 you’re not going to go, “Oh I’ve crossed the magic £4 a day figure” and turn the heating off, are you? …you know, only have half a bath, not a full one”; “in reality, you’re still going to carry on doing the same thing… it’s not giving you any information really, because you’re not going to change your habits just because you’re looking at a meter… it’s pointless”.
Ironically, others objected to smart meters on the basis that they provided accurate information: “It would probably just frighten me more than anything… I’d be walking around turning things off”. For others they raised cognitive dissonance, without action resulting: “I find it quite depressing because you can see how much it costs… and I think oh no, I don’t want to see that”
Methodology
In December 2020, we conducted 30 online interviews lasting between 60 and 90 minutes, Recruitment was done professionally, from 8 super-shortlisted LSOAs with top 10% gas, electricity or car mileage, energy efficient homes, and good public transport access, where household flight numbers are above average. We also recruited to avoid an unbalanced sample in terms of age, sex, and ethnicity, and 10 of the interviewees were ‘super-domestic’ or ‘super-mobility’ energy users, with monthly utility bills over £160, or high annual car mileage or numbers of flight. In fact, more than a third of our sample fitted the highest bills category, and one third of our sample took four or more flights annually, with one telling us that “I probably take, with holidays as well, maybe 60 flights a year”. Interviews were transcribed and then coded in Nvivo, with a coding structure which began with a deductive format to capture the content categories (home, heating, travel, mode, etc.) and then developed inductively, with initial checks using co-coding by three of the research team.
Section 4: Which policy approaches could reduce excess household energy consumption?
The previous sections of this report establish a need to tackle excess household energy consumption to enable a fair transition to a net-zero carbon economy, and have demonstrated that people with high energy use lifestyles view their consumption as normal and not excessive. Our next task, especially in the context of definitions of ‘excess consumption’ that are based on unreasonableness, was to deliberate on the different ways in which policymakers might fairly, effectively, and acceptably target and reduce such excessive consumption. In this section, we reflect on how members of the public (including our high-consuming interviewees) responded to different policy approaches to reduce their domestic and travel energy consumption.
Our workshops to explore policy options
Participants were provided with pre-workshop information on energy demand including a 20-minute videoOpens in a new tab, the need for climate mitigation, and four broad policy approaches to reduce energy demand (described below).
The deliberative discussions were focused around:
- how various policy approaches might impact upon different people and their everyday lives;
- what sorts of energy consumption and behaviour the policy approaches might best apply to;
- whether these were seen as fair ways to tackle high-energy consumption; and
- whether and under what conditions they might be implemented, both singly and in combinations.
Thus their fairness, effectiveness, acceptability, and the extent to which there might be trade-offs involved, were all explored in the discussions. The workshop participants were professionally recruited to ensure that we collected views from people with different levels of domestic and travel-related household energy consumption, as summarised in the Methodology summary at the end of this section. For each workshop, participants were selected with similar levels/types of energy consumption.
Summary: implications for policy
- Structural change received considerable support. This was understood to be a programme of major investment in providing or supporting low-carbon alternatives, particularly public transport, so that it rivals car use as the cheapest, most convenient or quickest travel option. It was felt that such investment needed to happen before policy sticks such as charges for car use were applied, in the name of fairness. In relation to public transport and renewables, there was an expectation that providing these was a policy responsibility, rather than a market-based approach. In relation to goods and appliances, it was felt that there was a role for legislation and regulation to raise energy efficiency standards, but also to remove inefficient options from the market. There was also some support for reducing road space for cars, but only alongside a prior provision of public transport.
- Economic (dis)incentives were a tool with general appeal, if they were used to make low carbon options cheaper and high carbon options more expensive. There was acknowledgement that such an approach goes ‘with the grain of consumer choice’ as the UK Net Zero Strategy stresses as a key principle. Subsidy, grants, and other positive economic supports were viewed more positively than fines, charges and other negative economic sticks. A number of specific suggestions were made, for example frequent flyer levies, and a similar rising scale of charges for car use, and for vehicle taxes, based on their environmental performance. It was also suggested that the revenues raised by any environmental taxes should be ringfenced for the structural changes that are required.
- Rationing approaches will be unpopular and difficult to implement in the face of individual needs and differences. But rationing was seen as most fairly applying to car mileages and air travel. One of the main objections to rationing was the idea that the rich would try to circumvent it somehow – which could be an argument for the fairness of the approach.
- Behaviour change was viewed as ineffective, and as demonstrably failing as a policy approach. Discussions in all four groups reinforced that relying on the public to ‘do the right thing’ was not a sensible approach, unless the choices available to people were significantly slanted towards low-carbon options, using the other policy approaches.
- A most interesting finding from the research was that some of the high energy consumers supported measures to penalise their own activities. Business flights in particular were seen as a valid target for taxing, but so was excessive car mileage and even ownership of expensive or environmentally damaging vehicles.
The following expands on some of the key messages from each workshop on the four policy approaches we were testing.
Policy approach 1: Rationing
In Workshop One (participants with high overall consumption), one (hyper-aero-mobile) participant felt that frequent global business travel by plane should be rewarded with larger rations, as their activities are of ‘global impact’, exemplifying the extreme end of a frequent flier’s understanding of rationing. Another participant rejected rationing of travel based on the idea that they had earned the right to travel:
“Now got the time, I’ve also got the money, so why should I be limited in travelling to the places I want to?”
This demonstrates a concept of fairness that means ‘fairness to me’. Another felt that (“draconian”) rationing of energy use might be sadly required if renewable energy production could not keep up with demand, and this unpopularity was echoed by others:
“Rationing is a no-no; I don’t think people will accept it.”
In Workshop Two (participants with high domestic consumption) rationing was also seen as draconian and unworkable by some. Others supported the idea of rations only transferable within a household or family, such as this comment from a disabled participant about travel rations:
“If there’s a need, so a family emergency, to go and see a loved one, then you can actually say to that person as part of the household, “You can have my allowance; I’m never going to use it.” Because otherwise I feel that I’m being discriminated twice; that I can’t travel, and on top of that, I’m losing out on my allowance. I know that sounds crazy, it’s good for the planet.”
The idea of rationing appliances was also discussed as applicable by offering a limited choice of models, and expecting manufacturers to repair them, but the costs involved were seen as unfair:
“The cost of the repairs might actually be costing you more overall, and it comes down to this wealthy/poor divide again. Like, wealthy people can afford the bigger fridges which are going to last longer.”
Ways of finessing rationing were suggested, including whether to apply rations at a household or individual level, or their being flexible by consumption type. Any version which maximised flexibility and choice was preferred:
“I think if you gave people the choice, it might make it more, a less bitter pill to swallow”; “People’s situations are different … every single person would have a different requirement, so to put a blanket, “Oh, this is how much you can do,” would just be completely unfair. I think as a general [principle]”.
In Workshop Three (participants with high travel consumption) many participants felt that it was preferable to ration business travel:
“It sounds like a good approach”; “Yeah, just for business, I find that a little bit more palatable, a bit more reasonable as a proposal.”
A general suggestion for travel rations as mileage was that (e.g. annual) rations could be saved up and ‘rolled over’ to a later year. There was a suggestion that “frivolous flying” and long-haul food transport could be targeted fairly:
“First of all… what I would call frivolous flights – people flying to Prague or Warsaw or Dublin, just for a weekend, for stag parties or hen parties… I think there is frivolous flying which none of us would be that much worse off if it was eliminated. And another example… fresh asparagus it had come from Peru. Well, why are we flying asparagus…?”
In Workshop Four (participants with low overall energy consumption) the concept of rationing had more support, being seen as fair and necessary:
“We’ve got to get into that mindset that we all have to infringe our own liberties in order to make this work, because we’ve been given the freedom and look where we are”; “I guess it’s fair…I think it’s sort of fair in a sort of communist way, you know, “This is your lot, this is what you get, and you cannot change it.” So in a way, it is completely fair.”
Others were opposed on principle:
“Nonsense and it won’t work… I don’t think rationing is a feasible idea at all.”
…seeing it as contradictory to current society:
“Everybody would have to follow the same lifestyle, and we live in a capitalist society where that doesn’t work.”
Flying was seen as a good target for rationing in this group. However, others applied exemptions, which showed that the idea of what counted as ‘unnecessary’ was not clear:
“When it comes to just holidays, it wouldn’t be part of it, you know, it would… there would be exemptions, I suppose. I don’t know how it would be regulated, but the idea would be to stop unnecessary travel.”
Policy approach 2: Structural change
In Workshop One (high overall consumption) this was viewed as a long-term process of investment in alternatives:
“20 years before people will give up what they’ve got, unless they absolutely are forced to do it” with a focus on “a public transport system that worked for everybody … that was run on an electric basis.”
This was seen as a pre-requisite for trying to get people to give up car usage:
“Getting on a bus that’s provided, that isn’t polluting, on a timetable that works, on a system and a road plan that works. I’d do it… but only after people have invested in [public] transport that works.”
This argument was obviously based on the comparative convenience, speed etc. of car use compared to public transport, which were seen as the basis of modal choice, rather than environmental arguments. Cheap or even free public transport was seen as an ideal solution:
“If I’ve got a choice of taking my car… when there’s regular bus services going round for free? I’d just use the bus, because it’s easy.”
The need for such structural change was seen as providing for the satisfaction of needs in everyday lifestyles:
“You know, if you spell it out in a very simplistic way, that’s what people want, they just want to be able to function on a daily basis with the amenities around them.”
There was reference to “green energy” (i.e. renewable electricity generation) as an obvious structural change, as it is now cheaper to produce than nuclear power or fossil-based energy. Older participants referred to other ‘structures’ which reduced domestic energy use, as having been ‘undone,’ such as bottle recycling, packaging avoidance, and:
“Electric milk carts… we did all of that, where did it go wrong?”
Structural change was viewed by this group as the most important policy approach to follow:
“There’s got to be a hierarchy of things to do, you can’t change people’s behaviour until the structures are in place for them to be able to change their behaviour. So I’m assuming the structural one’s got to be the top”; “So you come back to structural change… and that’s linked to the big one-off, 10s of billions, 100s of billions of investment we will need over the next 10/20 years.”
In Workshop Two (high domestic consumption) structural change in the form of reducing consumer options was supported as effective:
“Ban them completely, then people are forced to make other choices”; “I mean, it all comes down to the manufacturers, I think, doesn’t it?”
This was justified particularly in the case of appliances, whose efficiency cannot be ‘improved’ like houses; although energy efficiency standards exist, they still allow high-energy consumption choices:
“You can buy a house with a low energy rating and do things to improve that energy rating; you can’t buy a washing machine and improve the energy rating of it, same as you can’t do that with a TV. So why are we allowed to buy things that are so poor in their energy rating in the first place?”
In Workshop Three (high travel consumption) participants also felt that reducing options ‘at source’ was a fair (equitable) approach:
“I think structural change is the easiest way to make it fairer, because if you don’t… I guess if you don’t give people the option, and that is their only, like, their only choice, then at least everyone’s in the same playing field.”
In Workshop Four (low overall energy consumption), the main structural change discussed was again to the public transport system, which was seen as then progressively ‘stealing’ users from cars:
“If we want people to be using public transportation, and we want it to be accessible and, you know, so that there’s less cars on the road, we start from… the people that need this public transportation, and who really can’t afford to be running the car they’re running now, and then we work upwards… and change the minds of the people that have the three cars”.
Policy approach 3: Economic (dis)incentives
In Workshop One (high overall consumption) some felt economic approaches were unfair, allowing the rich to pay to pollute:
“So they can fly everywhere with their helicopters… and then that sort of defeats the object… the rich… nothing affects them. It’ll be the poor who take the brunt of it, same as they do with everything else, I suppose.”
Others were very firmly supportive of economic approaches as the only valid approach, working through choice and self-interest:
“I think the only way to do it is look at the fair taxes on some of this stuff”; “It’s all about self-interest and taxes. So we have to make inefficient carbon-emitting forms of transport prohibitive from a tax perspective and subsidise cleaner forms of transportation. And then people will make the choices themselves… you still give the perception of people being able to make the choice, because it’s in their self-interest.”
Two frequent fliers were in favour of themselves being disincentivised financially (via their employers) from business travel:
“In one year, I did, like, 70 long distance flights. It nearly killed me… what we need to do is tax me and my business more because they needed me to do that”; “I used to be out of the country 20 times a year, flying all over… it’s only right that… at least my company, should be paying the extra because of that, because they have an income to be able to deal with it.”
And they applied the same principle to road travel (calling for a steeply rising charge for higher annual mileages) and vehicle taxation:
“So it’s the same principle for road travel, you know… there are plenty of Porsches and Lamborghinis and Ferraris around here, you know, they should pay 10 times the amount of tax for the pleasure.”
It was thought important to avoid also penalising ‘normal people’:
“Not tax someone who’s just taking a holiday a year or travelling to Edinburgh to see their grandparents, right?”; “Not penalise people who need to just get to work… we should penalise the people who are using the system disproportionately.”
…and it was thought any green taxes should be ring-fenced:
“To be reinvested back in this massive investment that’s required to transition.”
Others suggested that economic measures were a motivator of last resort, for the self-interested:
“People, if they’re doing it for the right reasons, will not need a financial incentive. There’s always going to be a portion of society that won’t do anything unless it’s… going to hit their pocket”;
but as ultimately effective:
“We just won’t change our behaviour until we’re told to stop, or it becomes prohibitively expensive to do something in an environmentally unfriendly way.”
The same was seen as being true of businesses:
“If it’s imposed on them by taxing or by governments, then they have little choice… they have to pay it… at the end of the day, you have to force it on them.”
Some in Workshop Two (high domestic consumption) also felt the economic approach was required to tackle (through appealing to?) self-interest:
“There’s always going to be people that don’t care… they might need a bit of a bribe.”
Others focused on subsidies, and the need for government spending, with pandemic spending used as an example:
“I think people should be given grants… they do have a big pot of money that they can dip into… If you really want to make change, it’s got to be paid for. People on a certain wage… If you’re under a threshold, you should be eligible for a grant to get an electric car.”
Economics were seen at the centre of the issue:
“Whether it’s the government taxing people or the manufacturers charging more for better items… Although we’re talking about climate change it’s inextricably linked with money.”
and as being compatible with issues of choice;
“You will have to let the people have their choice but if they make that choice you have to tax them big.”
In Workshop Three (high travel consumption), one participant worried about ‘rebound’ effects on the pricing of non-flight travel, making it unattainable for the poor:
“Increasing flight costs is going to increase demand on trains and other public transport and then they might just up the prices… you need to mitigate, I just can’t see a world where that is not going to affect people on lower income.”
Objections to raising car taxes were based on ineffectiveness and car dependence:
“I think the costs of having a car and using a car are already very high, and there’s no real justification to add to that cost. Cars they’re essential for so many people, for their businesses, for getting around, meeting family members, friends.”
In Workshop Four (low overall consumption), by contrast, taxes on car use were supported:
“I think you’d maybe have to try and equate that with how many times they use the car or how many miles they do in the car, because I think then actually people would see it as being fairer.”
…as were incentives:
“For behaving in a way that’s super good for the environment, now, whatever that is.”
Another worried that any financial impositions on corporations and companies would be passed onto employees:
“Anything we do to corporations only affects the little people.”
Policy approach 4: Behaviour change
In Workshop One (high overall consumption) voluntary behaviour change was seen as slow or unlikely:
“The results are in the long-term”; “if you ask… then it’s going to take a long time and we don’t have time.”
…and being based on:
“A process of education, to an extent, and publicity and encouragement.”
…and therefore possibly ineffective. However, in terms of fairness:
“I don’t think it’s unfair… I don’t see why it would be unfair.”
In Workshop Two (high domestic consumption) behaviour change was seen as plausible by some:
“If we educate people enough on what the benefits of buying certain things are.”
…but as demonstrably failing, by others:
“The reason we’re in this position, and climate change is getting worse, is simply because the Government says, ‘Oh, let’s educate the people’, and nothing happens.”
As a policy approach, it was seen particularly as being ineffective compared to regulation:
“For example, it was the plastic bags, if they are such a problem, instead of just charging people, just ban them completely, then people are forced to make other choices.”
In Workshop Three (high travel consumption) similar opinions were echoed:
“Whatever change comes about has to be a driven directive. It can’t be something that is suggested because life will just carry on exactly the same way.”
In Workshop Four (low overall consumption) it was suggested that behavioural change only results from government action, in the form of e.g. ‘nudges’:
“I would love to see some sort of small nudge given to us from the Government, the council, whoever it is, just to facilitate more people to make those personal choices to get out of their cars and to cycle more… personal choice is great, but more people need to have, yeah, to be nudged to make those choices, somehow.”
Overall, a reliance on behaviour change was seen as:
“The status quo, isn’t it, relying on people to make choices? And we’re in a situation where it’s no longer working.”
Preferences
Figure 8 shows how coding reflective of positive/negative assessments, and discussions of preference were applied to the four different policy approaches and to issues of choice versus constraints, across all four workshops. It was clear that structural change (i.e. provision of alternatives such as renewable energy and public transport, and the removal of energy inefficient choices ‘upstream’) was the only approach that was viewed positively overall, with economic (dis)incentives as the next most positively viewed approach, with behaviour change being viewed as ineffective, and rationing positively disliked, overall. Despite favouring the removal of choices in principle, participants were overwhelmingly negative about constraints on their own lifestyles.
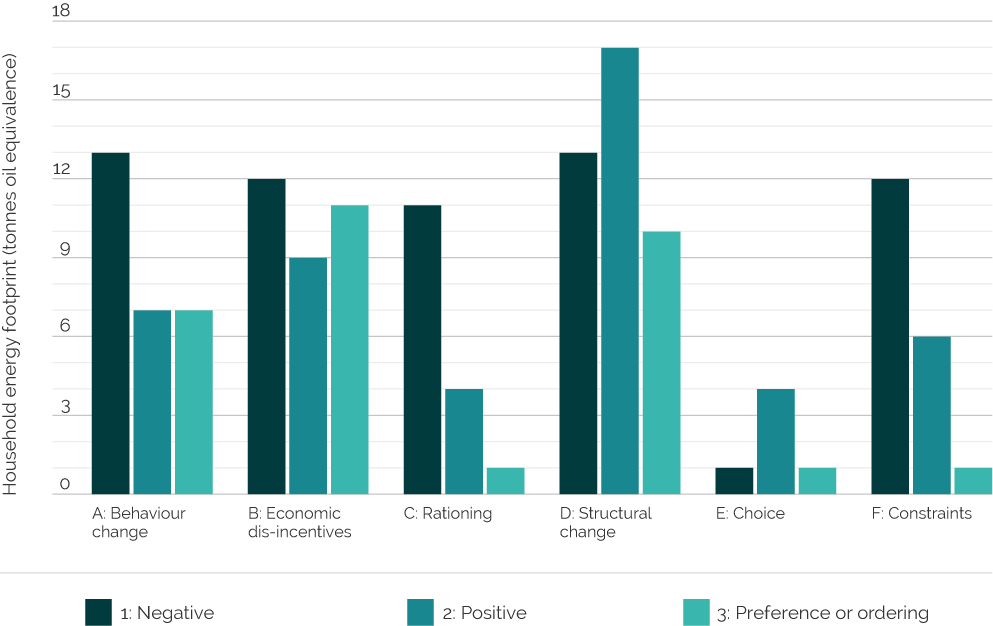
Image description
Bar chart of policy options, choice and interviewee’s preferences, measured in tonnes of oil equivalent: Behaviour change – 13 negative, 7 positive, 7 preference or ordering; economic dis-incentives – 12 negative, 9 positive, 11 preference or ordering; rationing – 11 negative, 4 positive, 1 preference or ordering; structural change – 13 negative, 17 positive, 10 preference or ordering; choice – 1 negative, 4 positive, 1 preference or ordering; constraints – 12 negative, 6 positive, 1 preference or ordering.
Methodology
The workshops were recruited using the same professional recruiters as our interviews, based on the characteristics shown in Table 2, to see if there were different responses from people with different levels of domestic and travel-related energy consumption. The quotas achieved in the participants in each workshop are detailed in Table 3.
| Workshop 1: |
|---|
| High mobility, high domestic energy consumption Recruited from interviewees. 10 highest consuming interviewees targeted first for re-booking in Workshop 1. |
| Workshop 2: |
| Low mobility, high domestic energy consumption All: energy bills > £120 Min: 1 x no car AND less than one return flight a year, on average Min: 1 x <5,000 miles p.a. AND less than one return flight a year, on average. Min 1 x any mileage p.a. AND no flights in last 5 years, on average. |
| Workshop 3: |
| High mobility, low domestic energy consumption All: energy bills < £80/mo Every recruit fits at least one of: 3+ cars in household, 2+ cars personally, 15,000+ miles car travelled annually, or 2+ return flights |
| Workshop 4: |
| Low mobility, low domestic energy consumption All: energy bills < £80/mo Min: 1 x no car AND less than one return flight a year, on average Min: 1 x <5,000 miles p.a. AND less than one return flight a year, on average. Min 1 x any mileage p.a. AND no flights in last 5 years, on average. |
| Criterion | Workshop | ||||
|---|---|---|---|---|---|
| One: High domestic, high mobility | Two: High domestic, low mobility | Three: Low domestic, high mobility | Four: Low domestic, low mobility | ||
| Gender | Male | 5 | 2 | 5 | 2 |
| Female | 3 | 5 | 3 | 6 | |
| Age | 18–40 | 2 | 3 | 3 | |
| 41–64 | 6 | 4 | 2 | 2 | |
| 65+ | 2 | 1 | 3 | 3 | |
| Ethnicity | White | 6 | 5 | 7 | 7 |
| BAME/other | 2 | 2 | 1 | 1 | |
| Bills | <£100 | 8 | 8 | ||
| £120–160/mo | 4 | 6 | |||
| £160+/mo | 4 | 1 | |||
| Car mileage p.a. | <5,000 | 2 | 3 | 6 | |
| 5–10,000 | 6 | 4 | 4 | 2 | |
| 10,000+ | 2 | 1 | 1 | ||
| Cars in household | 0 | 2 | 1 | ||
| 1 | 2 | 6 | 1 | 7 | |
| 2+ | 6 (1 x 3, 1 x 5+) | 1 | 5 (1 x 3+) | ||
| Annual return flights | 0 | 4 | |||
| 1 | 7 (<1) | 4(<1) | |||
| 2+ | 8 (2 x 4, 6 x 5+) | 8 | |||
References
Andersen, C. 2018. IPCC Report: Limiting Global Warming to 1.5°C requires 45% CO2 reductions by 2030 compared to 2010 – and zero emissions by 2050 (but which countries are to reduce how much per capita?)Opens in a new tab. Copenhagen: Climate Positions.
Barr, S., Shaw, G., Coles, T. and Prillwitz, J. 2010. ‘A holiday is a holiday’: practicing sustainability, home and away. Journal of Transport Geography, 18(3): 474–481. doi: 10.1016/j.jtrangeo.2009.08.007Opens in a new tab
Barrett, J., Pye, S., Betts-Davies, S., Eyre, N., Broad, O., Price, J., Norman, J., Anable, J., Bennett, G., Brand, C., Carr-Whitworth, R., Marsden, G., Oreszczyn, T., Giesekam, J., Garvey, A., Ruyssevelt, P. and Scott, K. 2021. The role of energy demand reduction in achieving net-zero in the UKOpens in a new tab. Centre for Research into Energy Demand Solutions. Oxford, UK. ISBN: 978-1-913299-11-8
Barrett, J., Taylor, P. and Owen, A. 2018. Funding a low carbon energy system: a fairer approach?Opens in a new tab UKERC Policy briefing. London: UK Energy Research Centre.
BEIS, 2019. UK becomes first major economy to pass net zero emissions lawOpens in a new tab. London: Crown Copyright.
BEIS, 2020. Digest of UK Energy Statistics (DUKES) 2020Opens in a new tab. London: Crown Copyright.
BEIS, 2021. Net Zero strategy: Build back greenerOpens in a new tab. London: Crown Copyright.
Bradshaw, J., Middleton, S., Davis, A., Oldfield, N., Smith, N., Cusworth,and Williams, J. 2008. A minimum income standard for Britain, pdfOpens in a new tab. York: Joseph Rowntree Foundation. ISBN: 978 1 85935 657 9
Brand-Correa, L.I., Mattioli, G., Lamb, W.F. and Steinberger, J.K. 2020. Understanding (and tackling) need satisfier escalation. Sustainability: Science, Practice and Policy, 16(1): 309–325. doi: 10.1080/15487733.2020.1816026Opens in a new tab
Brand, C. and Preston, J.M. 2010. ‘60-20 emission’—The unequal distribution of greenhouse gas emissions from personal, non- business travel in the UK. Transport Policy, 17(1): 9–19. doi: 10.1016/j.tranpol.2009.09.001Opens in a new tab
Brand, C., Anable, J., Ketsopoulou, I. and Watson, J. 2020. Road to zero or road to nowhere? Disrupting transport and energy in a zero-carbon world. Energy Policy, 139: 111334. doi: 10.1016/j.enpol.2020.111334Opens in a new tab
Büchs, M. Adeel, M., Anable, J., Cass, N., Chatterton, T., Ivanova, D., Lucas, K. and Mullen, C. Equitable energy reduction through ‘consumption corridors.’ (unpublished draft, available from first author).
Büchs, M. and Mattioli, G. 2021. Trends in air travel inequality in the UK: From the few to the many? Travel Behaviour and Society, 25: 92–101. doi: 10.1016/j.tbs.2021.05.008Opens in a new tab
Cass, N. 2021. Social and material cogs of the needs satisfier escalatorOpens in a new tab. Proceedings of the 2021 eceee Summer Study, paper 1-080-21. European Council for an Energy Efficient Economy.
Cass, N. and Faulconbridge, J. 2016. Commuting practices: New insights into modal shift from theories of social practice. Transport Policy, 45: 1–14. doi: 10.1016/j.tranpol.2015.08.00Opens in a new tab
CCC, 2018. Reducing UK emissions – 2018 Progress Report to Parliament, pdfOpens in a new tab. London: Climate Change Committee.
Defra and ONS (Department for Environment, Food and Rural Affairs, Office for National Statistics). 2019. Living Costs and Food Survey, 2006-2018: Secure Access. [data collection]. 13th Edition. UK Data Service. SN: 7047. doi: 10.5255/UKDA-SN-7047-14Opens in a new tab
Doyal, L. and Gough, I. 1984. A theory of human needs. Critical Social Policy, 4(10): 6–38. doi: 10.1177/026101838400401002Opens in a new tab
Doyal, L., and Gough, I. 1991. A theory of human need. London: Palgrave. doi: 10.1007/978-1-349-21500-3Opens in a new tab
Ekins, P. and Max-Neef, M.A. (eds). 1992. Real-life economicsOpens in a new tab. Understanding wealth creation: 197–213. London: Routledge.
Gössling, S. and Humpe, A. 2020. The global scale, distribution and growth of aviation: Implications for climate change. Global Environmental Change, 65: 102194. doi: 10.1016/j.gloenvcha.2020.102194Opens in a new tab
IGES, Aalto University, and D-mat Ltd. 2019. 1.5-Degree lifestyles: Targets and options for reducing lifestyle carbon footprintsOpens in a new tab. Technical Report. Hayama, Japan: Institute for Global Environmental Strategies (IGES).
Lamb, W.F. 2020. Guest post: How ‘discourses of delay’ are used to slow climate actionOpens in a new tab. London: Carbon Brief.
Lamb, W.F., Mattioli, G., Levi, S., Roberts, J., Capstick, S., Creutzig, F., Minx, J.C., Müller-Hansen, F., Culhane, T. and Steinberger, J.K. 2020. Discourses of climate delay. Global Sustainability, 3(e17): 1–5. doi: 10.1017/sus.2020.13Opens in a new tab
Lokesh, K., and Marsden, G. 2021. Estimates of the carbon impacts of commute travel restrictions due to Covid-19 in the UK. Findings, April 17. doi: 10.32866/001c.21574Opens in a new tab
Lucas, K. 2009. Actual and perceived car dependence: Likely implications of enforced reductions in car use for livelihoods, lifestyles, and well-being. Transportation research record, 2118(1): 8–15. doi: 10.3141/2118-02Opens in a new tab
Lucas, K., Cass, N. and Adeel, M. 2022. Social divisions in personal car ownership and use in England. In: Webb, J. et al. (Eds.) Research Handbook on Energy & Society. Edward Elgar: London. doi: 10.4337/9781839100710.00023Opens in a new tab Pages 184–199.
Lucas, K., Martens, K., Di Ciommo, F. and Dupont-Kieffer, A. (eds.) 2019. 1. Introduction. Measuring Transport Equity, Elsevier: 3–12. doi: 10.1016/B978-0-12-814818-1.00001-9Opens in a new tab
Mattioli, G. and Adeel, M. 2021. Long-distance travel. In: Vickerman, R., Noland, R.B. and Ettema, D. (eds.) International Encyclopedia of Transportation, Elsevier: 272–277. doi: 10.1016/B978-0-08-102671-7.10695-5Opens in a new tab
Mattioli, G., Lucas, K. and Marsden, G. 2017. Transport poverty and fuel poverty in the UK: From analogy to comparison. Transport Policy, 59: 93–105. doi: 10.1016/j.tranpol.2017.07.007Opens in a new tab
Max-Neef, M.A. 1991. Human scale development: conception, application and further reflections. New York: Apex Press.
Morgan, M., Anable, J. and Lucas, K. 2021. A place-based carbon calculator for England. Presented at the 29th Annual GIS Research UK Conference (GISRUK), Cardiff, Wales, UK: Zenodo. doi: 10.5281/zenodo.4665852Opens in a new tab
Newell, P. Daley, F. and Twena, M. 2021. Changing our ways? Behaviour change and the climate crisis: The report of the Cambridge Sustainability Commission on Scaling Behaviour Change, pdfOpens in a new tab. Cambridge: Cambridge University Press.
ONS, 2019. Road transport and air emissions: Contribution of road transport to greenhouse gas and air pollutant emissions – further analysis of the UK Environmental Accounts dataOpens in a new tab. London: Office for National Statistics.
Owen, A. and J. Barrett. 2020. Reducing inequality resulting from UK low-carbon policy. Climate Policy, 20(10): 1193–1208. doi: 10.1080/14693062.2020.1773754Opens in a new tab
Shove, E. 2003. Converging conventions of comfort, cleanliness and convenience. Journal of Consumer Policy, 26: 395–418. doi: 10.1023/A:1026362829781Opens in a new tab
Upton, G. and Cook, I. 1996. Understanding statisticsOpens in a new tab. Oxford: Oxford University Press.
Publication details
Cass, N., Lucas, K., Adeel, M., Anable, J., Buchs, M., Lovelace, R., Morgan, M. and Mullen, C. 2022. Curbing excess: high energy consumption and the fair energy transition. Centre for Research into Energy Demand Solutions. Oxford, UK. ISBN: 978-1-913299-14-9
Banner photo credit: Alireza Attari on Unsplash