
John Barrett, Steve Pye, Sam Betts-Davies, Oliver Broad, James Price, Nick Eyre, Jillian Anable, Christian Brand, George Bennett, Rachel Carr-Whitworth, Alice Garvey, Jannik Giesekam, Greg Marsden, Jonathan Norman, Tadj Oreszczyn, Paul Ruyssevelt and Kate Scott
In recent years, global studies have attempted to understand the contribution that energy demand reduction could make to climate mitigation efforts. Here we develop a bottom-up, whole-system framework that comprehensively estimates the potential for energy demand reduction at a country level. Replicable for other countries, our framework is applied to the case of the United Kingdom where we find that reductions in energy demand of 52% by 2050 compared with 2020 levels are possible without compromising on citizens’ quality of life. This translates to annual energy demands of 40 GJ per person, compared with the current Organisation for Economic Co-operation and Development average of 116 GJ and the global average of 55 GJ. Our findings show that energy demand reduction can reduce reliance on high-risk carbon dioxide removal technologies, has moderate investment requirements and allows space for ratcheting up climate ambition. We conclude that national climate policy should increasingly develop and integrate energy demand reduction measures.
Since the Paris Agreement was signed, global assessments have shown the important role that reducing final energy demand can play in meeting international climate targets by easing pressure on the decarbonisation of energy supply and reducing the need for carbon dioxide removal (CDR) [1,2,3]. Yet, global final energy demand continues to grow; since 2000, it has increased at an average annual rate of 1.9% [4]. This growth continues to be met, in part, by fossil fuels. New low carbon energy, particularly renewable generation, is not keeping pace with increasing demand [5,6]. While the carbon intensity of the global energy system is falling, at its current rate, it would take 150 years to fully decarbonise [7]. This highlights the importance of actions that reduce energy demand for meeting stringent targets.
The bottom-up framing of the Paris Agreement means that the responsibility for reducing greenhouse gas (GHG) emissions and delivering climate action is at the country level. Many countries have revisited their initial nationally determined contribution (NDC) assessments and have developed long-term low emissions development strategies [8], including net-zero emission targets. Despite this, current pledges by countries continue to fall short of the 1.5 °C target [9]. A stronger focus on energy demand reduction in national mitigation plans could reduce this shortfall by realising the potential identified in global assessments, particularly in nations with disproportionately high energy use.
Recognising this gap, we develop a framework to comprehensively estimate the potential for final energy demand reduction at a country level. This framework, replicable for other countries, is applied here to a case study of the United Kingdom, providing the most comprehensive assessment to date of the potential for energy demand reduction at the national level. We show that for a country in the global North, such as the United Kingdom, it is possible to halve energy demand by 2050 without negatively affecting citizens’ quality of life. This results in a per capita energy use in the United Kingdom in 2050 of around 40 GJ compared with a present global average of 55 GJ per capita. We also find that the role of CDR technologies, which have yet to be proven at scale, is substantially reduced or eliminated, reducing the risk of failing to achieve climate objectives should such technologies not materialise in a timely manner. Further, the required annual investment to expand the electricity generation system is reduced by up to 40% by 2050.
Finally, the option for additional ratcheting of climate ambition becomes possible due to the smaller energy system, its associated lower emissions and the potential for faster implementation of demand-side measures. Crucially, such a strategy does not compromise quality of life but rather realises strong co-benefits of climate action, such as healthier active lifestyles, lower urban airborne pollution and improved work-life balance. With policy implemented at the national level, a stronger focus on the potential for final energy demand reduction at this level is critical to the delivery of GHG emission reductions and the many associated benefits.
The potential role for energy demand reduction
Global energy demand increases are being driven by economic growth and the rising demand for energy services. Between 1971 and 2018, on average, every 1% of additional global gross domestic product (GDP) has increased energy demand by 0.68% [10]. This growth in demand has occurred despite a period of substantial energy efficiency improvement across all sectors [11]. Notwithstanding, modelling assessments have highlighted the contribution energy demand reduction could make to meeting climate goals. Grubler et al. construct a scenario that reduces global energy demand by 40%, negating the need for CDR, with different pathways for global North and South regions [2]. The International Energy Agency’s Sustainable Development Scenario [12] and Net Zero by 2050 [1] roadmap focus on the potential of energy efficiency improvements from investment in new technologies, arguing that these measures are crucial to the decarbonisation of energy systems. Kikstra et al. highlight that an energy efficiency-focused recovery from the Covid-19 pandemic would reduce the cost of meeting the Paris Agreement [13]. The literature also includes scenarios on how energy demand could be reduced through changes to how society consumes energy services. There are various terms used to describe this mechanism, such as ‘lifestyle change’ [14,15,16], ‘behaviour change’[1,12,17] or ‘social change’ [18,19].
To date, comprehensive energy demand reduction scenarios have focused at a multi-national or global level. While global analysis provides useful framing, mitigation targets and climate policies are necessarily devised at the national level. This presents a gap in the national scenarios literature that has direct policy relevance, namely the potential for energy demand reduction to help deliver stringent mitigation targets [20] (Supplementary Note 2). We use the United Kingdom as a case study to explore this potential, given its legally binding targets for short- and long-term GHG emissions [21,22] (Supplementary Note 1) and extensive development and use of scenario analysis of decarbonisation pathways [22]. This case study develops a modelling framework that brings together sector-level energy demand modelling with a whole-systems energy model to determine the role of energy demand reduction in achieving ambitious climate targets [23].
A national modelling framework for energy demand reduction
As argued in Pye et al. [24], most energy-modelling approaches focus on representing the energy supply system to meet a set of exogenous energy service-demand projections. Energy services refer to the utility we derive from energy, such as lighting, thermal comfort, leisure, mobility and food. While energy efficiency gains are often represented to some extent, solutions that help avoid energy service demand altogether, or that shift to cleaner forms of demand provision are often missing [25].
We propose a modelling framework for national analysis which identifies and integrates essential steps to better understand and quantify the contribution of energy demand reduction to climate targets (Figure 1). First, it allows for assessment of how energy demand reductions can contribute to achieving net-zero emissions through near- and medium-term emission reductions. These changes are developed in step with a corresponding supply-side system and its necessary technology change. Second, it goes beyond options to ‘improve’ energy efficiency and considers solutions for energy demand reduction that ‘avoid’ energy use and ‘shift’ to more efficient energy demand provision [25]. This recognises the need for a stronger focus on the socio-technical dimension of transitions. It identifies that reducing energy demand is not just a matter for energy policy but extends to other policy areas and stakeholders. Thirdly, it provides simultaneous and consistent whole economy and sector-level perspectives. This captures the detail required at the sector level and reflects the diverse strategies that are applied across different sectors. The whole-system perspective is crucial to capture the linkages and trade-offs between sectors, helping ensure consistency based on the chosen scenario narrative. This also facilitates dialogue between sector experts and a shared understanding of different aspects of the narrative.
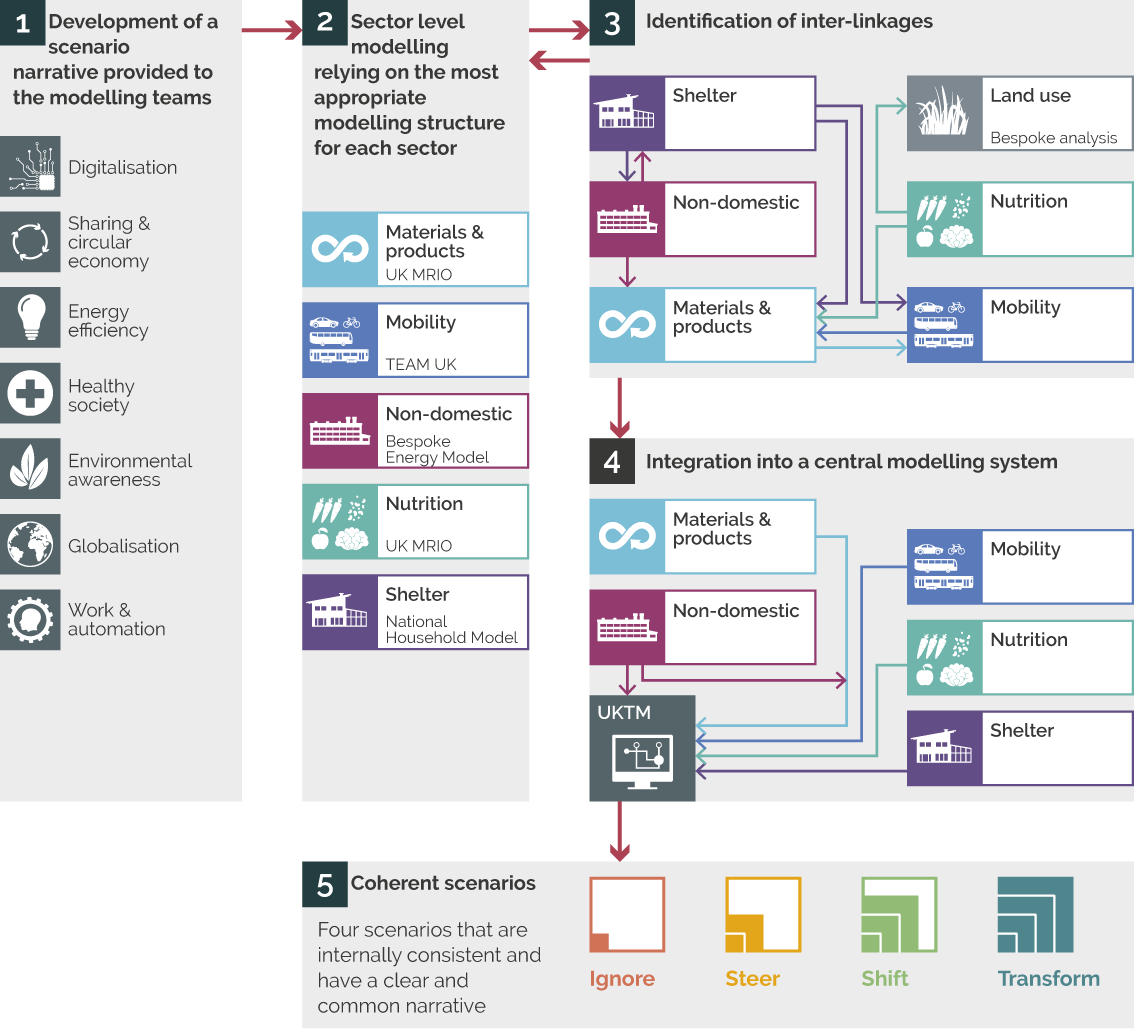
Image description
Stage 1 Development of a scenario narrative which is shared with the modelling teams. Stage 2, sector-level modelling which relies on the most appropriate modelling structure for each sector. Stage 3 identifies interlinkages which are fed back into the models in stage 2. Stage 4 integrates results into a central modelling system (UKTM) to produce four coherent scenarios in stage 5: Ignore demand, Steer demand, Shift demand and Transform demand.
Our modelling framework builds on and extends past advances in energy demand modelling outlined by Grubler et al. [2] and demonstrates how these can be transferred into a national modelling framework to assess the potential for energy demand reduction (Figure 1). We start by developing narratives based on known drivers of future energy demand (Step 1). These included similar trends to those considered by Grubler et al. [2] covering digitalisation, sharing and circular economy, energy efficiency, healthy society, environmental awareness, globalisation and work and automation (Supplementary Note 3).
| Scenario name | Description |
|---|---|
| Ignore | Identifies levels of energy demand up to 2050 assuming only existing UK government climate policy instruments are implemented (as of 2018). This includes existing policy for delivery of emission reductions but not climate targets or ambition. |
| Steer | Adopts the more ambitious legislated target of net-zero GHG emissions by 2050 but falls just short of meeting it. Uses the same energy service-demand projections as the Ignore scenario but implements a wide range of energy efficiency options. |
| Shift | Similarly to Steer, adopts the net-zero GHG emissions target. Significant shift in the attention given to energy demand strategies, providing an ambitious programme of interventions across the whole economy describing what could possibly be achieved with currently available technologies under current social and political framings. |
| Transform | Similarly to Shift, this scenario adopts the net-zero GHG emissions target. Considers transformative change in technologies, social practices, infrastructure and institutions to deliver both reductions in energy but also numerous co-benefits such as health, improved local environments, improved work practices, reduced investment needs and lower cumulative GHG emissions. |
These narratives are then implemented in sector models to derive detailed energy service demands and their evolution over time (Step 2), highlighting differences in the role for energy demand reduction. In parallel with Step 2, an iterative process is undertaken to map the dependencies to ensure consistency among sectors (Step 3). The resulting energy service demands and other demand-sector assumptions are then fed into a whole-systems modelling framework in which scenarios are assessed (Step 4). This allows us to assess supply-side implications that reflect demand-side changes across all sectors. Finally, the outputs from the whole-systems model are used to describe a set of coherent scenarios (Step 5). This approach is further elaborated in the Methods, with additional detail in Supplementary Notes 3 and 4.
The potential for energy demand reduction in the United Kingdom
To demonstrate the application of our framework to the UK context of getting to net-zero GHG emissions by 2050, we consider four scenarios as listed in Table 1, each with differing levels of energy demand reduction.
The key insights from these energy demand scenarios highlight the benefits of the proposed framework when analysing stringent emission targets. First, energy demand reduction options that stretch beyond energy efficiency measures can lead to considerably higher levels of energy demand reduction in all energy service sectors. Second, these reductions can significantly curb the need for deploying large-scale engineered CDR options such as bioenergy with carbon capture and storage (BECCS) or direct air capture. Third, a reduction in energy demand can substantially reduce the investment requirements across the energy system. Finally, energy demand reductions offer earlier mitigation opportunities and a greater reduction in cumulative emissions, allowing for ratcheting of climate ambition.
As indicated in Figure 2, the most ambitious energy demand scenario, Transform, represents a 52% reduction in final energy consumption by 2050 compared with 2020. In comparison, energy efficiency measures alone deliver savings of 31% under the Steer scenario. The difference highlights the important role that shifting and avoiding demand can play in reducing energy use. It is the use of this additional potential that means that both low energy demand scenarios, Transform and Shift, meet the United Kingdom’s net-zero target, while Steer comes up short by 27 MtCO2e.
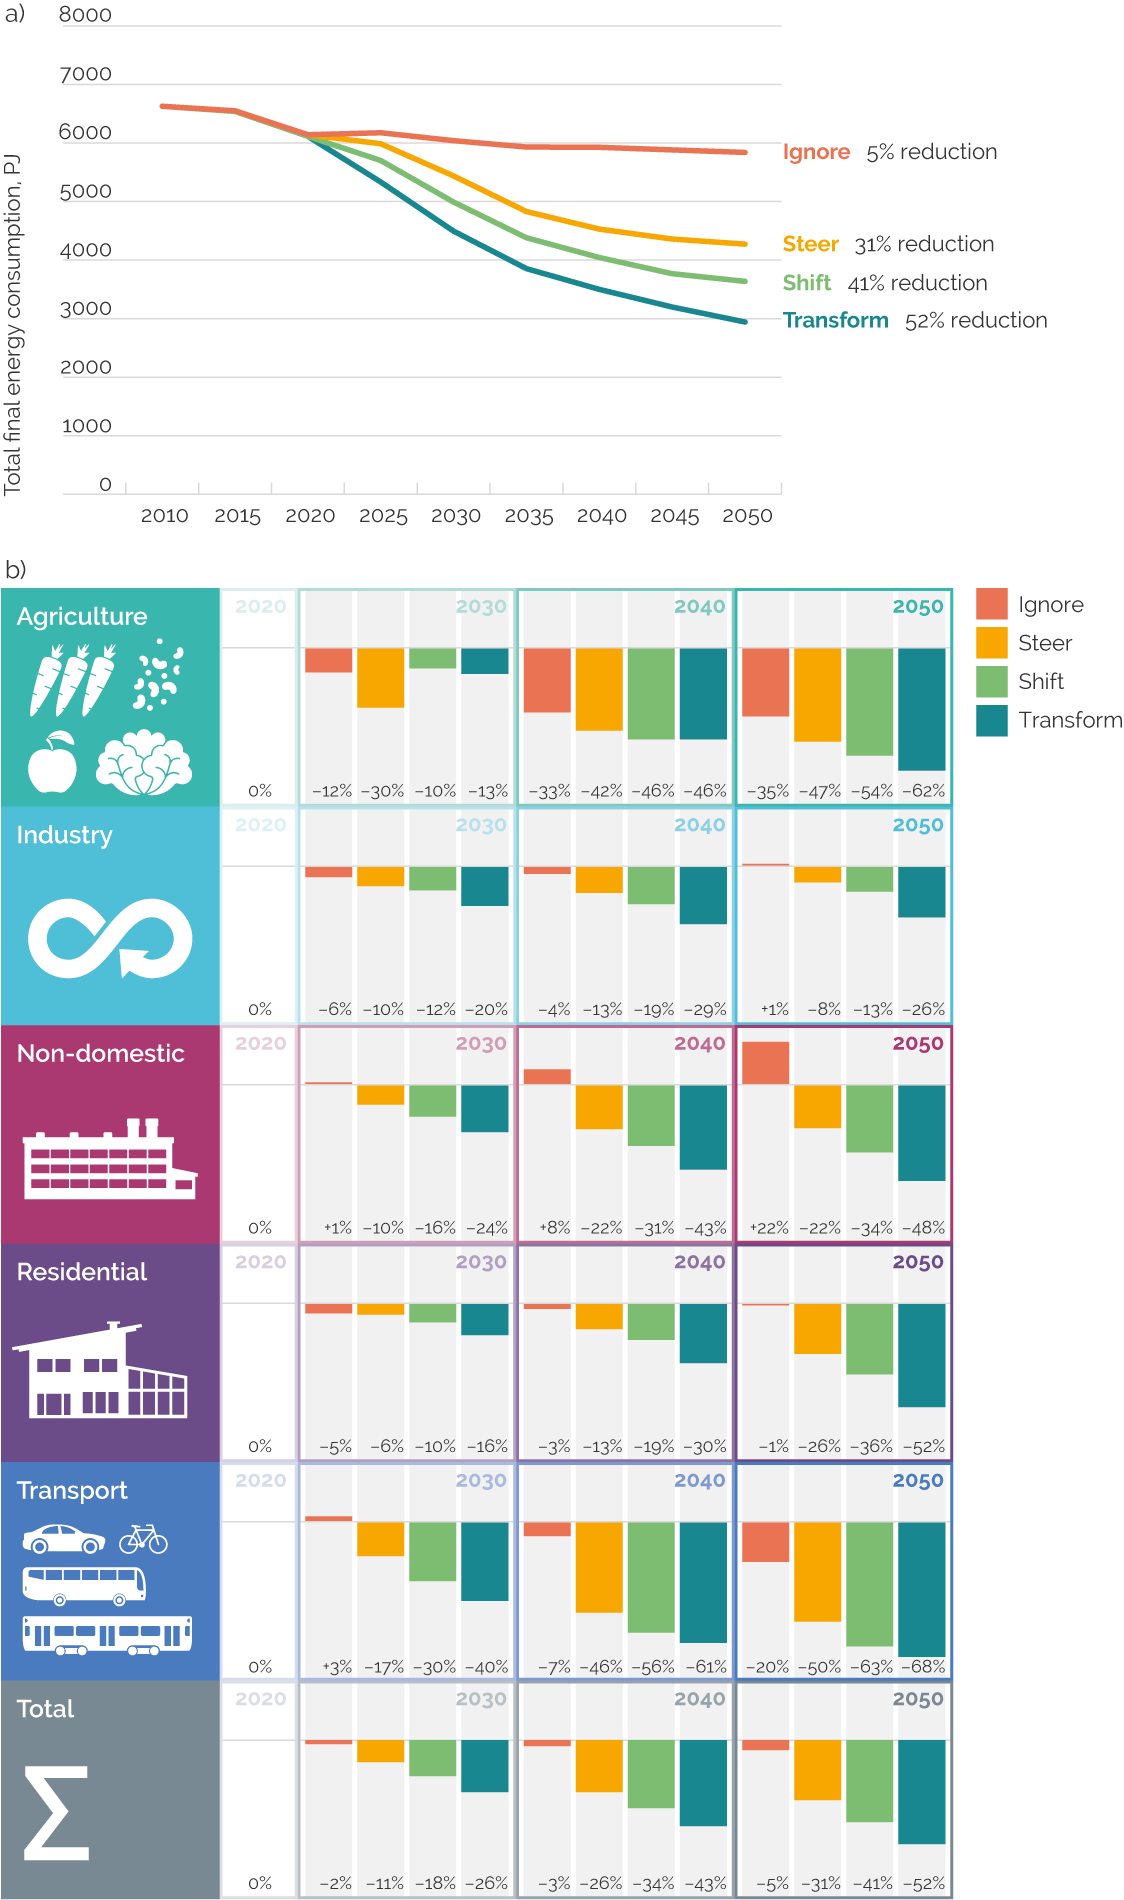
The reductions observed in our scenarios imply that substantial changes are required across all sectors. For example, Transform sees reductions of over 50% in energy demand across all sectors, except industry, which the transport sector compensates for with reductions of over 60%.
For the Transform scenario, this is equivalent to per capita energy use of 40 GJ, compared with the current global average of 55 GJ while the average Organisation for Economic Co-operation and Development is 116 GJ [4]. The analysis in Grubler et al. [2] suggests the global North could reduce energy demand to 49 GJ per capita by 2050 (Supplementary Note 6 provides a comparison with Grubler et al [26]. However, it is worth noting that the United Kingdom’s energy demand is currently below the average of the global North (Supplementary Note 1), one reason being the reliance of the United Kingdom on overseas industrial production and the net imports of embodied energy to satisfy its consumption [27].
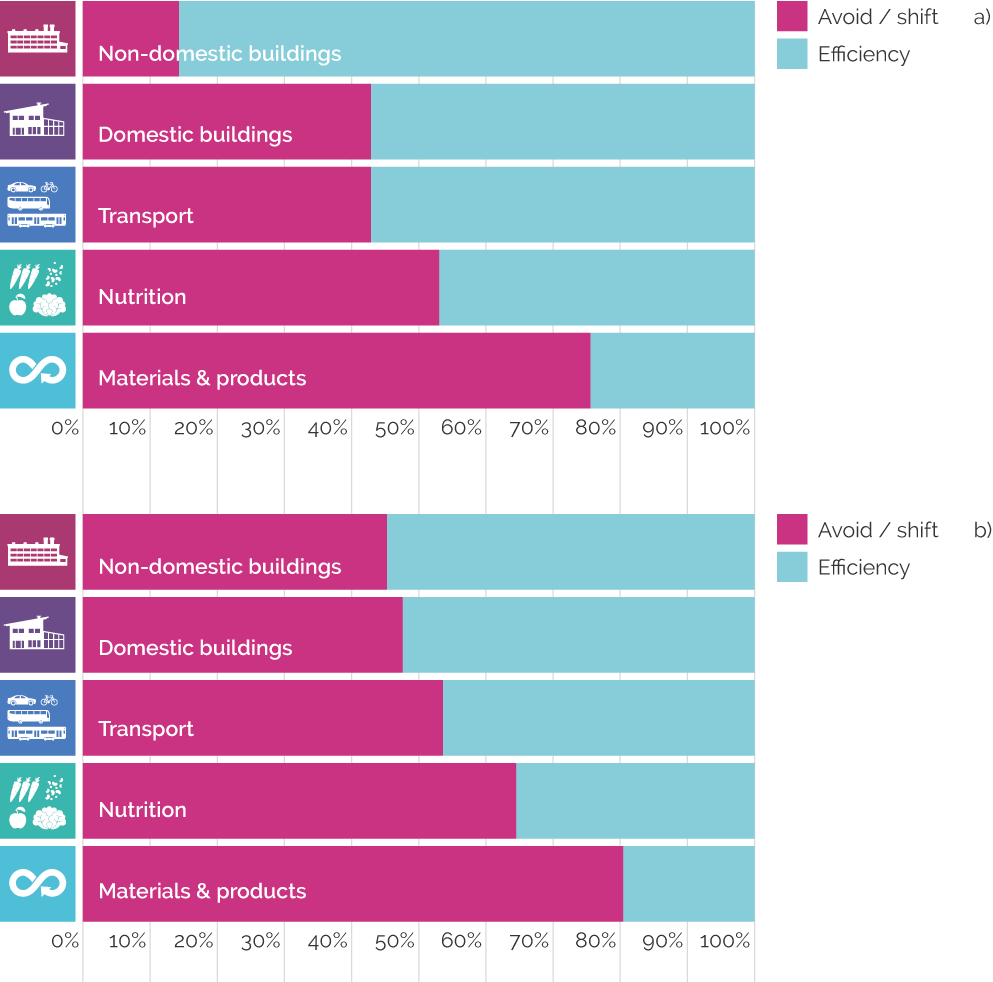
Reductions in energy demand in the Shift and Transform scenarios, relative to the Ignore scenario, are split into the contributions from avoid/shift measures and changes in efficiency in Figure 3. Avoid/ shift measures indicate changes in energy service demands linked to broader societal changes in consumption, which are especially important in the Transform scenario. Considerable variation exists among sectors, with buildings relying more on efficiency measures that maintain energy service demand (further information on the decomposition can be found in Supplementary Note 6).
Effects on the energy system and climate targets
There are significant risks around decarbonisation strategies that rely heavily on the scale-up of CDR [24, 28]. Figure 4 a & b shows that strong demand-side action can significantly reduce the reliance on such engineering solutions by reducing energy demand across the economy and lowering associated emissions. Removal through BECCS and direct air capture, shown in Figure 4a, total 49 MtCO2e in 2050 for the Steer scenario, which increases to 76 MtCO2e if we infer that the identified emissions gap to net zero also requires removal. For context, residual emissions of 76 MtCO2e represents around 17% of 2019 territorial emissions in the United Kingdom [29]. This level can be more than halved to 37 MtCO2e in Shift or removed completely under Transform where no engineered removal is required. The Transform scenario deploys more nature-based removal options (Figure 4b), reaching up to 60 MtCO2e by 2050. However, the system could still achieve net zero with less than 30 MtCO2e of nature-based removal and no engineered solutions, highlighting lower dependency on removal more broadly.
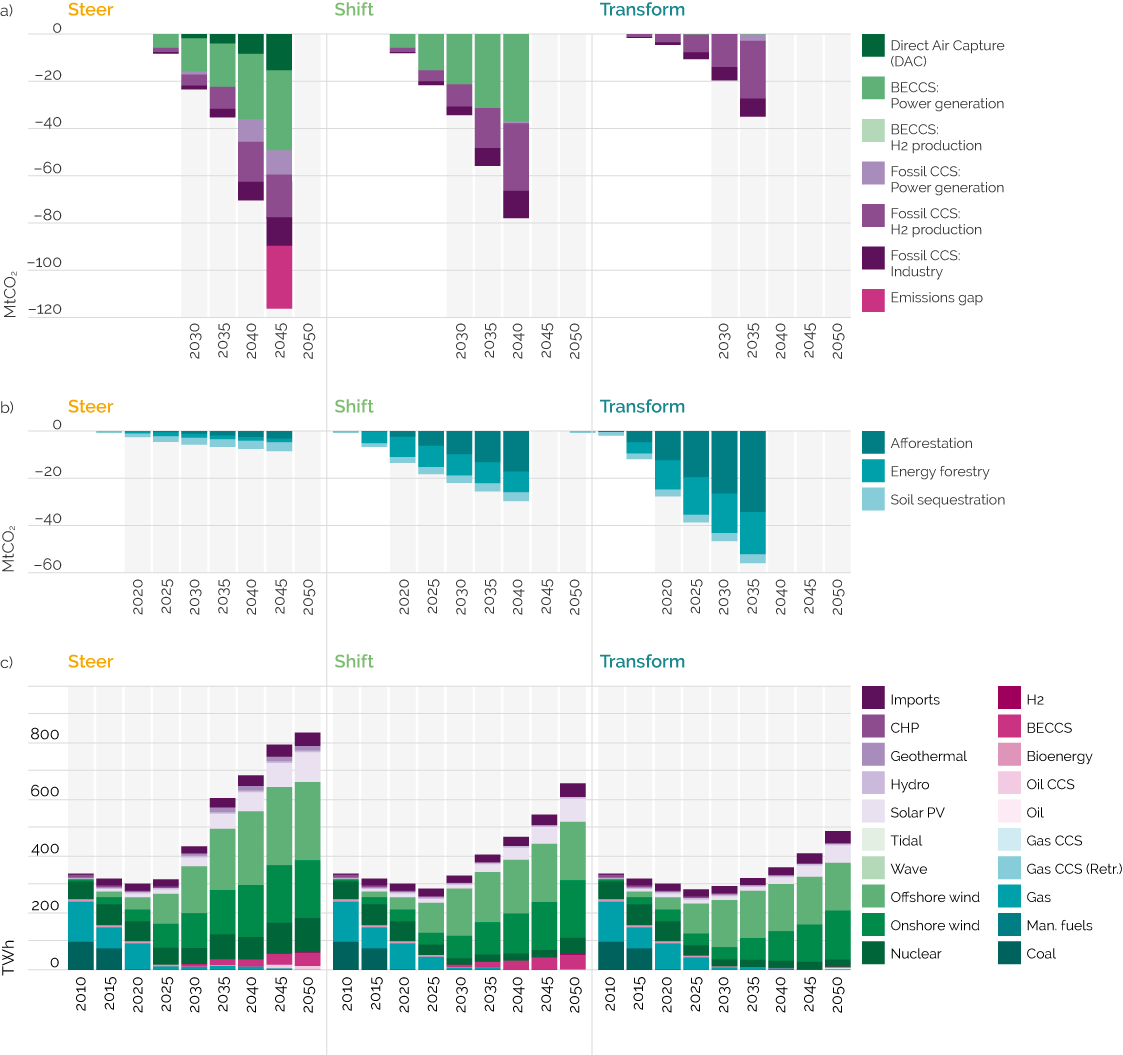
Under a net-zero target, the energy supply system needs to be transformed to decarbonise the wider economy. This challenge is significant, given the need for high levels of societal acceptance of new technologies and overcoming the sizable challenge around building out a new infrastructure in a short period of time. The smaller energy system in the lower energy demand scenarios helps to moderate this challenge. For instance, while in all three scenarios, electricity needs to be both decarbonised and scaled up, this scaling of generation is lower under Shift and Transform at a 94% and 44% increase, respectively, relative to 2020, compared with 150% under Steer (Figure 4c). When considering the implications for specific technologies, this means that significant capacity expansion in complex nuclear or BECCS for power technologies is either reduced or not required. This is also the case for other sectors, reflected in overall system costs being 20–40% lower in 2050 under the Shift and Transform cases, respectively, relative to Steer. Overall investment requirements in low carbon infrastructure and technologies are reduced, making raising capital more manageable (Supplementary Note 6).
Finally, on emissions-reduction targets, there have been calls to further strengthen climate ambition in the United Kingdom to reflect a more equitable allocation of global efforts to reduce emissions [30,31]. Anderson et al. [30] have called for the adoption of more stringent targets, translating to lower cumulative CO2 emissions (of around 21%) that better reflect an equitable apportionment of the remaining global carbon budget in a way that is consistent with the Paris Agreement. To understand whether demand reduction enables ratcheting up the United Kingdom’s climate ambition, we modelled our transform scenario using a tighter cumulative carbon budget derived by Anderson et al. [30] (Supplementary Note 5).
Our analysis finds that many energy demand reduction options can occur in the short term, allowing for stronger near-term emissions reductions and an overall lower level of cumulative emissions of 3.87 GtCO2, compared with 4.82 GtCO2 in Transform. This allows time for time-intensive infrastructure to be built while still reducing emissions in the short term. By 2030, the Transform scenario under the tighter carbon budget sees a 47% emissions reduction relative to 2020, compared with a 41% reduction under Transform and 37% under Steer. Crucially, this earlier action keeps the window open for further strengthening the climate ambition and reducing cumulative emissions further. This ability of demand-side action to support near-term emissions reductions is important for countries that might be considering options to strengthen their nationally determined contributions.
Discussion and conclusion
This research shows substantial unexplored potential to reduce energy demand in global North countries that can make a significant contribution to near-term emission reductions and long-term national and international climate goals. Our analysis demonstrates that it is possible to operationalise the scale of reduction identified by Grubler et al. [2] that suggested a 56% reduction in energy demand in global North countries. We have independently replicated the extent of this reduction in our study (Supplementary Note 6 provides comparison between studies), strengthening the case for energy demand reduction in climate change mitigation. However, variation in the level of reduction across sectors indicates the need to tailor scenarios to the national context. Many of the interventions identified will be relevant to other countries; however, we recognise their level of implementation will vary by country. Our framework provides a template that can assess the relative contribution of these interventions on energy demand reductions to meet emission targets. It is the use of detailed sectorial models with a systems-integration model, tied together by a rich scenario narrative recognising sectoral inter-linkage that is replicable.
Without energy demand reduction, short-term climate targets are unlikely to be reached and long-term net-zero ambitions will need to rely on expensive and unproven CDR technologies, increasing the risk of failing to achieve the global goals of the Paris Agreement. The UK case study presented here suggests that there is significant potential for global North countries to reduce energy demand, reducing pressure on the decarbonisation of supply and deployment of CDR. At a national level, this potential is currently under-explored and is often limited to a range of energy demand technologies as opposed to taking a broader approach that encompasses societal change to shift and avoid energy service demand. With the rapid cuts in global carbon emissions required over the next ten years, particularly where energy use is high in the global North, energy demand reductions are essential.
Deep reductions in energy demand involve both rapid shifts to more energy efficient technologies alongside broader societal transformations that maintain quality of life while reducing energy service demands. The first are truly global opportunities, while the second currently have greater potential in the global North, where they can be pursued across most sectors without compromising quality of life. While our scenario is transformative in that it halves energy demand in the space of 30 years, it does not describe a world that is entirely unrecognisable today. There are significant conversion efficiency improvements, structural shifts and changes in investment patterns and some societal practices; however, essential energy services demands are maintained or even enhanced.
These shifts naturally raise important questions about their broader, economy-wide implications that, while far from trivial, are likely to be manageable when addressed upfront. The example of rebound effects applies here. While these are notoriously difficult to estimate [10], they can be mitigated through the broader societal trends towards sustainable production and consumption, through the decarbonisation of energy systems and through direct policy. Historically, rebound effects have been studied in isolation and therefore understanding the macro-level rebounds of demand-led transitions, and their negation, is an important avenue for further work and policy development.
We recognise there are significant broader economic, social and political implications that require careful consideration, further research and effective policy design to realise the scale of reductions presented in our scenarios. In future work, a stronger linkage between the scenario narrative and the granular measures included in the sectoral modelling will assist in determining necessary policy packages. Further analysis is also needed to understand how to deliver the scenarios while ensuring a just and equitable transition, the overall economic effects of demand-led transitions and how to enact structural change, taking into account the complex issues of investment and stranded assets. Many of these issues are not unique to energy demand-focused scenarios but are relevant to all rapid transitions.
Methods
Assessment framework
The description of our methods are organised around the steps outlined in our framework diagram in Figure 1.
Step 1
Some modelling approaches are designed to provide a ‘prediction’ or ‘forecast’ of the future. That is not the case with our analysis; rather we are creating ‘simulations’ of potential futures based on a well-developed narrative, written by experts across a range of disciplines and fields. This narrative is used to inform a bottom-up analysis of energy service demands in each sector, which are subsequently used in an economy-wide model to construct ‘net-zero’ scenarios for the United Kingdom. Overall, our scenario approach is designed to give insights into the scale of change in energy demand and GHG emissions that is possible under certain circumstances.
Step 1 of our approach is the development of a scenario narrative that is underpinned by seven observable underlying trends that have impacted energy demand and/or are likely to continue to do so throughout the scenario timescale. Our list of underlying trends is not exhaustive as various other observable societal, political, economic and scientific or philosophical trends may impact energy demand, such as demographic changes. We also recognise that there is considerable crossover between the various trends and that some could have the potential to increase and further reduce energy demand [32]. Nevertheless, developing this narrative gives the sectoral scenarios a consistent underpinning. The underlying trends are listed below and described in further detail in Supplementary Note 4. Supplementary Table 1 in Supplementary Note 3 provides a mapping between the different energy services demands and the underlying trends provided below.
- Digitalisation. The integration of digital systems and information and communications technology into the energy system is already driving significant changes in the energy sector and is likely to accelerate change in the future from promoting new energy business models through to changing how consumers interact with energy services.
- Sharing and circular economy. The ‘sharing economy’ is an approach that aims to decrease the number of under-utilised ‘owned’ assets in an economy by creating new business models that offer a service in its place [2]. The ‘circular economy’ is a concept that explores resource efficiency strategies to extend the time that resources are retained in the economy to reduce material throughput and environmental impacts [33,34,35].
- Energy efficiency. Energy efficiency has steadily improved by 1% annually over the past 30 years, with no indication that the potential for further energy efficiency improvements is saturated [36].
- Healthy society. The context of the Covid-19 pandemic has increased global focus on health, well-being and quality of life at the policy level and by individuals.
- Environmental awareness. As climate and ecological breakdown accelerate and significant climate impacts of events, such as wildfires and flooding, gain global attention, public concern for the environment grows across the globe.
- Globalisation. Increasing globalisation in the form of international production networks and global value chains has a wide range of impacts on national final energy demand in different countries.
- Work and automation. This trend considers the distinct impact that automation may have on working patterns in the United Kingdom and how this may change the demand for energy services.
Step 2
The options for delivering energy demand reduction vary considerably across different sectors. The technologies and embedded social practices are entirely different for different energy service demands. We therefore employ specific sector models to determine the energy demand for each sector before combining this information into a central whole-system energy-modelling framework. A brief description of each model is included below, while more details of each model and the underlying sectoral modelling assumptions can be found in Supplementary Note 4.
For Mobility, the TEAM-UK (Transport Energy Air pollution Model for the UK) [37] is used. TEAM-UK is a transport–energy–environment system-modelling framework that simulates passenger demand as a function of key travel indicators, built around detailed travel demand data from the UK National Travel Survey.
The nutrition (including agriculture) and materials and products sector modelling utilised hybrid UK MRIO (multi-regional input output) models. The hybrid UK MRIO utilised for nutrition modelling is a Leontief physical input–output food system model, constructed from observed economic data of intermediate and final demand [38]. For the materials and products modelling, a hybrid UK MRIO model was used to determine the supply chain impacts and the ultimate impact on production requirements from UK industry. The construction sector energy service demands (included within the materials and products sector) are modelled separately using a bespoke model that considers 36 specific applications of key materials across 17 different built-asset categories. The UK National Housing Model (NHM) [39] is a micro-simulation model that utilises national housing survey data to explore the future of energy service demand in the domestic building stock. Finally, a bespoke sectoral model for non-domestic buildings was developed for this analysis and built around the UK Building Energy Efficiency Survey (BEES) dataset [40] to explore different rates of energy efficiency uptake.
Step 3
A critical part of the sectoral modelling process is to map the dependencies between sectors to ensure consistency so that key aspects of the narrative represented in one sector are also reflected in others. This is an important part of the approach to ensure that the scenarios are internally consistent.
Many linkages relate to the shelter analysis, highlighting dependencies where shifts in working patterns fundamentally change the types and patterns of mobility demand and the use of non-domestic buildings. In the case of non-domestic buildings, repurposing floor space in offices and retail spaces links back to impacts upon shelter demand. Other important cross-sectoral linkages include differences in house-building assumptions, and choices about necessary transport infrastructure are reflected in the demands for construction materials. Further, changes in vehicle sales impact manufacturing. Changes to diet impact the level of land take, which feeds into land availability for forestry and the level of output in specific food and drink subsectors, impacting energy demand in that sector.
Step 4
The next step of the approach is to combine the sector analyses into an integrating framework, primarily to explore the system-wide implications of lower energy demand requirements on energy supply and the role of CDR. For this, we use UKTM, a technology-explicit, whole-system, partial-equilibrium model that relies on the TIMES model-generator framework [41]. The model optimises future energy system evolution using linear programming, optimising future investment choices to meet energy service demands at least cost (based on minimising the discounted net present value for the whole system). The model has been used across a wide range of energy scenario studies [42,43,44,45,46]. In recent years, it has been co-developed with the United Kingdom’s energy ministry (BEIS), which has used it extensively to inform energy strategies [47,48,49].
The model represents the existing energy system in 2010, including the existing infrastructure assets (power generation plants, vehicle stock and so on) and flows of energy both between and across sectors. In UKTM, the whole system is represented, from resource extraction, through to primary and secondary fuel production (electricity, hydrogen, biofuels) and finally consumption in the residential, industrial, service, transport and agricultural sectors. This final consumption is used to meet the wide range of final energy service demands needed across the economy, such as mobility, heating and industrial production. In addition to energy service demands, GDP and population growth are exogenous to the model. These two variables have not been adjusted in the scenarios, and further research is required to explore the potential effects on GDP in particular with considerably lower energy demand.
For scenario exercises, projected energy service demands are exogenous inputs into the model. Their changes over time are the main drivers for investment and system development in the model which solves by exploring least-cost supply-side solutions to meet these future service demands. ‘Supply-side’ refers to any part of the system used to supply energy to meet energy service demands. This includes transformation/conversion processes, for example, electricity generation, and all of the technologies used in end-use sectors, for example, gas boilers, cars, cement kilns and so on. It also includes some explicit energy-saving measures in the buildings sector, such as fabric retrofit. The whole-system representation allows for explicit trade-offs between sectors in respect of resource allocation. Demands for energy vectors, such as electricity and hydrogen, are endogenous to the model and sensitive to changing prices driven by the dynamics of balancing demand and supply. The other benefit of the whole-system representation is that it allows for comprehensive and internally consistent accounting of both energy- and key non-energy related greenhouse gases, including, for example, agriculture and land use. This means the model can be used for exploring energy systems that meet climate and energy policy goals.
Under each scenario, the sectoral modelling (steps 2 and 3) provides estimates of energy reduction through ‘improve, shift and avoid’ measures. Two types of information relevant to energy demand are passed for use in UKTM:
- Energy service-demand projections. These projections inform how energy services will change over time, based on ‘avoid’ measures and some ‘shift’ measures in transport. They are exogenous inputs to the whole-system model and are based directly on projected energy service demands from the sector models (Supplementary Tables 3 and 4 in Supplementary Data 1 provide projections).
- Technology efficiency measures. The sectoral analyses take account of opportunities for ‘improving’ the efficiency of energy use and shifting to cleaner energy use. Such measures include improved efficiency of technologies, switching to electricity-using appliances and building retrofits. Such measures are typically considered endogenously by UKTM; therefore, we have not hardwired efficiency-related energy demand reductions in to UKTM from the sectoral modelling. Rather we have tried to align input assumptions on technology efficiency and deployment rates, followed by an iterative process of checking model outputs with sector teams. The approach to endogenise sectoral assumptions in UKTM means that there are some differences between the sectoral and UKTM outputs. Differences have been tolerated where these are not significant, particularly as the key insights from UKTM relate to implications for energy supply to end-use sectors. Appliances were included within domestic and non-domestic sectors.
The linkages between sector models and UKTM are described in turn below. Further information on specific UKTM assumptions across sectors can be found in Supplementary Note 4.
Mobility
The sectoral modelling approach for mobility includes the development of energy service demands based on in-depth assessment of a range of behavioural levers that are then fed into the UK Transport Energy and Air Pollution Model (TEAM) [37] to explore journey distance by purpose, mode choices, vehicle choices and rates of deployment. International aviation was restricted to an assessment of energy service demands influenced mainly by socio-economic, demographic and policy (for example, changes in the cost of air travel via pricing such as frequent flier levy) drivers. Shipping was not included in the TEAM analysis and was considered separately by the UKTM team.
UKTM received energy service-demand projections for all transport subsectors, except shipping. On energy technology assumptions, the key alignment was on vehicle efficiency factors to those in TEAM. The modelling teams also iterated on UKTM constraints, including rates of technology deployment.
Shelter
This analysis uses the UK’s National Household Model (NHM), focusing on heating requirements under different scenarios, which factor in varying levels of new house building, retrofitting and other behavioural changes.
For this sector, UKTM received the energy service demands for space and water heating. Given that these energy service demands already include heat demand savings from energy efficiency measures, building-retrofit options were switched off in UKTM to avoid double counting. The NHM already underpins energy technology assumptions in the UKTM residential sector, meaning that further alignment was required only around elements adjusted for this analysis, for example, heat pump deployment rate and coefficient of performance as they differ between scenarios.
Non-domestic
The sectoral modelling for non-domestic buildings was built around the UK Building Energy Efficiency Survey (BEES) dataset [50] and is used to explore different rates of energy efficiency uptake across the three modelled scenarios. By reviewing the current and future expected building stock for each of the main subsectors, including main commercial, leisure and public service building uses, this approach estimates the full technical savings potential across the sector and translates different levels of ambition into varying growth rates for corresponding energy efficiency options.
The results from this model provided direct input into UKTM by informing the total energy efficiency gains from building-retrofit and management measures that are not related to technology replacement. These include fabric, building instrumentation and control and carbon and energy management systems. Their roll-out was then limited in UKTM according to the levels of ambition relevant to each scenario. Efficiency gains from technology switching (primarily through electrification) are estimated endogenously in UKTM.
In parallel, different growth trajectories for future building stock number – proxied through total floor space requirements – were developed for each scenario. These were built specifically for this sector but were developed in consultation with experts across the project to mirror changing pressures on, for example, storage space requirements in line with changes in retail shopping and home delivery. These floor space requirements then provided the main energy driver input into UKTM as their change over time was used to inform future growth in energy service demand in the model.
Materials and products
The input to the industry sector of UKTM was from the sector analysis of resource efficiency gains as estimated in UK MRIO. The approach was to first apply resource efficiency percentage gains to the UKTM growth drivers; these growth drivers are largely taken from the UK government econometric energy demand model, EDM [51]. In addition, further adjustment factors to account for changes in infrastructure construction in other sectors, for example, buildings and transport, were applied to key sectors producing construction materials, for example, iron and steel and cement.
Nutrition
The integration into UKTM of the sector analysis of nutrition covers the resulting on-farm agricultural changes in terms of emissions and land availability, due to changes in the overall national diet and scenarios for the reduction of food waste throughout the supply chain. Because of the low level of detail in the UKTM agriculture sector, the link was made through the emissions of CH4 and N2O relating to crops and livestock which were updated to follow the trends seen in the sectoral modelling for each scenario. The resulting land freed up by a shift to a more plant-based diet was used to define new limiting constraints on the planting of forests within UKTM (both for biodiversity and energy crops) such that the more ambitious the nutrition scenario, the more land that becomes available for forests out to 2050. Finally, the assessment of food waste generation from the sector analysis for each scenario were used to adjust the trends shaping the scale of food waste production in UKTM.
Step 5
We have developed four scenarios, Ignore, Steer, Shift and Transform. These are described in more detail in Supplementary Table 2 (Supplementary Note 4).
Our Shift and Transform scenarios are our so-called low energy demand scenarios. They assume a national attempt to rapidly reduce energy demand in the United Kingdom to increase the likelihood of meeting ambitious climate outcomes in the short and long term. Our scenarios provide an analysis of the total final energy demand in the United Kingdom and are also broken down into the five high-level categories of mobility, residential buildings, non-domestic buildings, nutrition and materials and products.
In addition to the low energy demand scenarios, two additional scenarios were considered at the system level in the UKTM analysis for comparative purposes.
These include a scenario called Ignore demand, based on achieving reductions as estimated in the Climate Change Committee 2018 progress report, including medium risk policies [52]. The second scenario is called Steer demand, which aims for net-zero GHG emissions by 2050, based on all the United Kingdom’s legislated carbon budgets, including the sixth carbon budget (−78% GHG reduction in 2035 relative to 1990 levels). However, the scenario fails to achieve the 2050 target, falling short by 27 MtCO2 despite high levels of removal. It relies on improved energy efficiency and supply-side options only, with no consideration of measures for avoiding energy use or shifting to options that supply energy services with less energy, for example, private cars to public transport. This implies that without further demand-side efforts, the United Kingdom’s net-zero target will be very difficult to meet.
References
- IEA, 2021. Net Zero by 2050: A roadmap for the global energy sector, pdfOpens in a new tab. Paris: International Energy Agency (IEA).
- Grubler, A., Wilson, C., Bento, N., Boza-Kiss, B., Krey, V., McCollum, D.L. et al. 2018. A low energy demand scenario for meeting the 1.5°C target and sustainable development goals without negative emission technologies. Nature Energy, 3(6): 515–527. doi: 1038/s41560-018-0172-6Opens in a new tab
- IPCC, 2018: Summary for PolicymakersOpens in a new tab. In: Global Warming of 1.5°C. An IPCC Special Report on the impacts of global warming of 1.5°C above pre-industrial levels and related global greenhouse gas emission pathways, in the context of strengthening the global response to the threat of climate change, sustainable development, and efforts to eradicate poverty [Masson-Delmotte, V., et al (eds.)]. World Meteorological Organization, Geneva, Switzerland. 32 pp.
- IEA, 2021. Key world energy statistics 2021Opens in a new tab. Paris: International Energy Agency.
- IEA, 2020. World total final consumption by source, 1973–2018Opens in a new tab. Paris: International Energy Agency.
- BP, 2021. Statistical review of world energy 2021Opens in a new tab. London: BP.
- Romanello, M., McGushin, A., Di Napoli, C., Drummond, P., Hughes, N., Jamart, L. et al. 2021. The 2021 report of the Lancet countdown on health and climate change: code red for a healthy future. Lancet, 398(10311): 1619–1662. doi: 1016/S0140-6736(21)01787-6Opens in a new tab
- UNFCCC, 2021. Communication of long-term strategiesOpens in a new tab. Bonn: UNFCCC.
- Ou, Y., Iyer, G., Clarke, L., Edmonds, J., Fawcett, A.A., Hultman, N.et al. 2021. Can updated climate pledges limit warming well below 2°C? Science, 374(6568): 693–695. doi: 1126/science.abl8976Opens in a new tab
- Brockway, P.E., Sorrell, S., Semieniuk, G., Heun, M.K. and Court, V. 2021. Energy efficiency and economy-wide rebound effects: A review of the evidence and its implications. Renewable and Sustainable Energy Reviews, 141: 110781. doi: 1016/j.rser.2021.110781Opens in a new tab
- IPCC 2014. Climate Change 2014: Synthesis Report Summary for policymakers, pdfOpens in a new tab. Geneva: Intergovernmental Panel on Climate Change.
- IEA 2020. Energy Technology Perspectives 2020Opens in a new tab. Paris: International Energy Agency (IEA).
- Kikstra, J.S., Vinca, A., Lovat, F., Boza-Kiss, B., van Ruijven, B., Wilson, C. et al. 2021. Climate mitigation scenarios with persistent COVID-19-related energy demand changes. Nature Energy, 6: 1114–1123. doi: 1038/s41560-021-00904-8Opens in a new tab
- Eyre, N., Brand, C., Layberry, R., Anable, J. and Strachan, N. 2009. Energy Lifestyles. In: Ekins, P. and Skea, J. [eds] ENERGY 2050: Making the transition to a secure and low-carbon energy system: Synthesis reportOpens in a new tab. 103–118. London: UK Energy Research Centre (UKERC).
- Van Vuuren, D.P., Stehfest, E., Gernaat, D.E.H.J., Van Den Berg, M., Bijl, D.L., De Boer, H.S., Daioglou, V., Doelman, J.C., Edelenbosch, O.Y., Harmsen, M., Hof, A.F. and Van Sluisveld, M.A.E. 2018. Alternative pathways to the 1.5°c target reduce the need for negative emission Nature Climate Change, 8(5): 391–397. doi: 10.1038/ s41558-018-0119-8Opens in a new tab
- Institute for Global Environmental Strategies, Aalto University, and D-mat ltd. 2019. 5-Degree lifestyles: Ttargets and options for reducing lifestyle carbon footprintsOpens in a new tab. Technical Report. Institute for Global Environmental Strategies, Hayama, Japan.
- Niamir, L., Ivanova, O. and Filatova, T. 2020. Economy-wide impacts of behavioral climate change mitigation: Linking agent-based and computable general equilibrium models. Environmental Modelling and Software, 134: 104839. doi: 1016/j.envsoft.2020.104839Opens in a new tab
- Kuhnhenn, K., Costa, L., Mahnke, E., Schneider, L. & Lange, S. 2020. A societal transformation scenario for staying below 1.5°COpens in a new tab. Germany: Heinrich Böll Stiftung.
- Ivanova, D., Barrett, J., Wiedenhofer, D., Macura, B., Callaghan, M. and Creutzig, F. 2020. Quantifying the potential for climate change mitigation of consumption options. Environmental Research Letters, 15(9): 093001. doi: 1088/1748-9326/ab8589Opens in a new tab
- Lepault, C. & Lecocq, F. 2021. Mapping forward-looking mitigation studies at country level. Environmental Research Letters, 16(8): 083001. doi: 1088/1748-9326/ac0ac8Opens in a new tab
- BEIS 2020. Digest of United Kingdom energy statistics 2020Opens in a new tab. London: Crown
- Pye, S., Li, F.G.N., Price, J. and Fais, B. 2017. Achieving net-zero emissions through the reframing of UK national targets in the post-Paris Agreement era. Nature Energy, 2: 17024. doi: 1038/ nenergy.2017.24Opens in a new tab
- CCC 2020b. Sixth Carbon Budget: The UK’s Path to Net ZeroOpens in a new tab. London: Climate Change Committee.
- Pye, S., Broad, O., Bataille, C., Brockway, P., Daly, H.E., Freeman, R. et al. 2021. Modelling net-zero emissions energy systems requires a change in approach. Climate Policy, 21(2): 222–231. doi: 1080/14693062.2020.1824891Opens in a new tab
- Creutzig, F., Roy, J., Lamb, W.F., Azevedo, I.M.L., Bruine De Bruin, W., Dalkmann, H. et al. 2018. Towards demand-side solutions for mitigating climate change. Nature Climate Change, 8(4): 268–271. doi: 1038/s41558- 018-0121-1Opens in a new tab
- Grubler, A., Wilson, C., Bento, N., Boza-Kiss, B., Krey, V., McCollum, D.L. et al. 2018. A low energy demand scenario for meeting the 1.5°C target and sustainable development goals without negative emission technologies. Nature Energy, 3(6): 515–527. doi: 1038/s41560-018-0172-6Opens in a new tab
- Defra, 2021. UK’s Carbon Footprint 1997–2018Opens in a new tab. London: Crown Copyright
- Anderson, K. and Peters, G.P. 2016. The trouble with negative emissions. Science, 354(6309): 182–183. doi: 1126/science.aah4567
- BEIS 2021. Final UK greenhouse gas emissions national statistics: 1990 to 2019Opens in a new tab. London: Crown
- Anderson, K., Broderick, J.F. and Stoddard, I. 2020. A factor of two: how the mitigation plans of ‘climate progressive’ nations fall far short of Paris-compliant pathways. Climate Policy, 20(10): 1290–1304, doi: 1080/14693062.2020.1728209Opens in a new tab
- Jackson, T. 2019. Zero carbon sooner – the case for an early zero carbon target for the UKOpens in a new tab. Guildford: Centre for the Understanding of Sustainable Prosperity.
- Brugger, H., Eichhammer, W., Mikova, N. and Dönitz, E. 2021. Energy Efficiency Vision 2050: How will new societal trends influence future energy demand in the European countries? Energy Policy, 152: 112216. doi: 1016/j.enpol.2021.112216Opens in a new tab
- Cooper, S.J.G., Giesekam, J., Hammond, G.P., Norman, J.B., Owen, A., Rogers, J.G. and Scott, K. 2017. Thermodynamic insights and assessment of the ‘circular economy’. Journal of Cleaner Production, 162: 1356–1367. doi: 1016/j.jclepro.2017.06.169Opens in a new tab
- Hahladakis, J.N., Iacovidou, E. and Gerassimidou, S. 2020. Plastic waste in a circular economy. Plastic Waste and Recycling, 2020. 481–512. doi: 1016/B978-0-12-817880-5.00019-0Opens in a new tab
- Scott, K., Giesekam, J., Barrett, J. and Owen, A. 2019. Bridging the climate mitigation gap with economy-wide material productivity. Journal of Industrial Ecology, 23(4): 918–931. doi: 1111/jiec.12831Opens in a new tab
- Lees, E. and Eyre, N. 2021. Thirty years of climate mitigation: lessons from the 1989 options appraisal for the UK. Energy Efficiency, 14: 37. doi: 1007/s12053-021-09951-2Opens in a new tab
- Brand, C., Anable, J., Philips, I. and Morton, C. 2019. Transport energy air pollution model (TEAM): methodology guide, pdfOpens in a new tab. London: UK Energy Research Centre (UKERC).
- Garvey, A., Norman, J.B., Owen, A. and Barrett, J. 2021. Towards net zero nutrition: The contribution of demand-side change to mitigating UK food emissions. Journal of Cleaner Production, 290: 125672. doi: 1016/j.jclepro.2020.125672Opens in a new tab
- CSE, 2014. National Household ModelOpens in a new tab. Bristol: Centre for Sustainable Energy.
- BEIS 2016b. Building Energy Efficiency Survey (BEES)Opens in a new tab. London: Crown Copyright.
- Loulou, R., Lehtilä, A., Kanudia, A., Remme, U. and Goldstein, G. 2016. Documentation for the TIMES Model: Part II, pdfOpens in a new tab. Paris: Energy Technology Systems Analysis Programme (ETSAP).
- Fais, B., Keppo, I., Zeyringer, M., Usher, W. and Daly, H. 2016. Impact of technology uncertainty on future low-carbon pathways in the UK. Energy Strategy Reviews, 13: 154–168. doi: 1016/j.esr.2016.09.005Opens in a new tab
- Pye, S., Li, F.G.N., Price, J. and Fais, B. 2017. Achieving net-zero emissions through the reframing of UK national targets in the post-Paris Agreement era. Nature Energy, 2: 17024. doi: 1038/ nenergy.2017.24Opens in a new tab
- Fuso Nerini, F., Keppo, I. and Strachan, N. 2017. Myopic decision making in energy system decarbonisation pathways. A UK case study. Energy Strategy Reviews, 17: 19–26. doi: 1016/j.esr.2017.06.001Opens in a new tab
- Zeyringer, M., Price, J., Fais, B., Li, P.H. and Sharp, E. 2018. Designing low-carbon power systems for Great Britain in 2050 that are robust to the spatiotemporal and inter-annual variability of weather. Nature Energy, 3: 395–403. doi: 1038/s41560-018-0128-xOpens in a new tab
- Broad, O., Hawker, G. and Dodds, P.E. 2020. Decarbonising the UK residential sector: The dependence of national abatement on flexible and local views of the future. Energy Policy, 140: 111321. doi: 1016/j.enpol.2020.111321Opens in a new tab
- DECC 2016. Impact Assessment for the level of the fifth carbon budget, pdf. London: Crown
- BEIS, 2017. Building our industrial strategyOpens in a new tab. London: Crown
- BEIS, 2021. Net Zero Strategy: Build back greener. London: Crown
- BEIS, 2016. Building energy efficiency survey, 2014–15: Overarching report, pdfOpens in a new tab. London: Crown
- BEIS, 2019. Energy and emissions projections methodology overview, pdfOpens in a new tab. London: Crown
- CCC 2018b. Reducing UK emissions: 2018 Progress Report to ParliamentOpens in a new tab. London: Climate Change Committee.
License
This article is licensed under a Creative Commons Attribution 4.0 International License, which permits use, sharing, adaptation, distribution and reproduction in any medium or format, as long as you give appropriate credit to the original author(s) and the source, provide a link to the Creative Commons license, and indicate if changes were made. The images or other third party material in this article are included in the article’s Creative Commons license, unless indicated otherwise in a credit line to the material. If material is not included in the article’s Creative Commons license and your intended use is not permitted by statutory regulation or exceeds the permitted use, you will need to obtain permission directly from the copyright holder. To view a copy of this license, visit creativecommons.org/licenses/by/4.0/.
Publication details
Barrett, J., Pye, S., Betts-Davies, S., Broad, O., Price, J., Eyre, N., Anable, J., Brand, C., Bennett, G., Carr-Whitworth, R., Garvey, A., Giesekam, J., Marsden, G., Norman, J., Oreszczyn, T., Ruyssevelt, P. and Scott, K. 2022. Energy demand reduction options for meeting national zero-emission targets in the United Kingdom. Nature Energy, 7: 726–735. doi: 10.1038/s41560-022-01057-yOpens in a new tabOpen access
Banner photo credit: Alireza Attari on Unsplash