We’ve recently made some changes to the design of the CREDS website to improve it’s energy efficiency rating. In this blog, Hannah Harris explains why we think that’s important and how usability of content plays a crucial role.
It was estimated in 2019 that digital technologies were responsible for 4% of greenhouse gas emissions. Websites don’t seem like an obvious offender when it comes to energy usage, but every website you have ever visited is hosted on a server, often in big data centres which also require energy consuming cooling systems. Data centres, transmission networks and end use devices (e.g. laptops and smart phones) all use electricity. Lots of it.
Every time we go online, energy is being consumed in hidden ways. According to the Sustainable Web Manifesto: “If the Internet was a country, it would be the 7th largest polluter.”
Efficiency improvements in networks and devices
On the one hand, efficiency improvements in data transmission networks are lowering energy use. Improvements in mobile networks, like 5G, also come with promises of greater energy efficiency. By 2022, 4G and 5G networks together are expected to carry 83% of mobile traffic, compared with less than 1% for 2G. However, according to recent CREDS research, whether the energy saving improvements in 5G will be sufficient to offset projected increases in data traffic is still unclear. Also, as data becomes cheaper, this could lead to even more usage.
improving the energy efficiency of mobile networks does not guarantee that their energy consumption will fall, and, in fact, it is perfectly possible for the energy consumption of mobile networks to rise because of improvements to their energy efficiency.
Should we worry about lowering the carbon footprint of an individual website?
Compared to the travel and transportation system, the energy consumed by our digital lives might seem quite small in comparison and it’s true, without the Internet enabling us to attend online meetings, access websites and apps to get our data and communicate with each other, we’d have to find other, potentially more energy consuming ways to do that. But does that mean we shouldn’t worry about lowering the carbon footprint of an individual website?
At CREDS, we don’t think so. The design of a website directly contributes to how much data is needed every time a user visits it. According to the IEA, data transmission networks (the transfer of data from one digital device to another) alone consumed 1.1‑1.4% of global electricity use in 2020. As a result, we’ve made a few changes to improve our site’s footprint.
Usability and findability of content
The easier the content is to find on a website, the less time a user spends looking at content that isn’t useful, which means less time consuming energy. How you structure, organise and label content on a site, matters. Enhancing the user experience so that users can find the things they want and perform the tasks they need to do in the most efficient way possible is the first step to improving a site’s carbon footprint. The CREDS website was built following an extensive discovery stage – which involved testing the structure to ensure content was easy to find for our identified and defined target audiences. Iterative design has been forefront and the site’s structure is reviewed and improved upon as content needs change.
Images
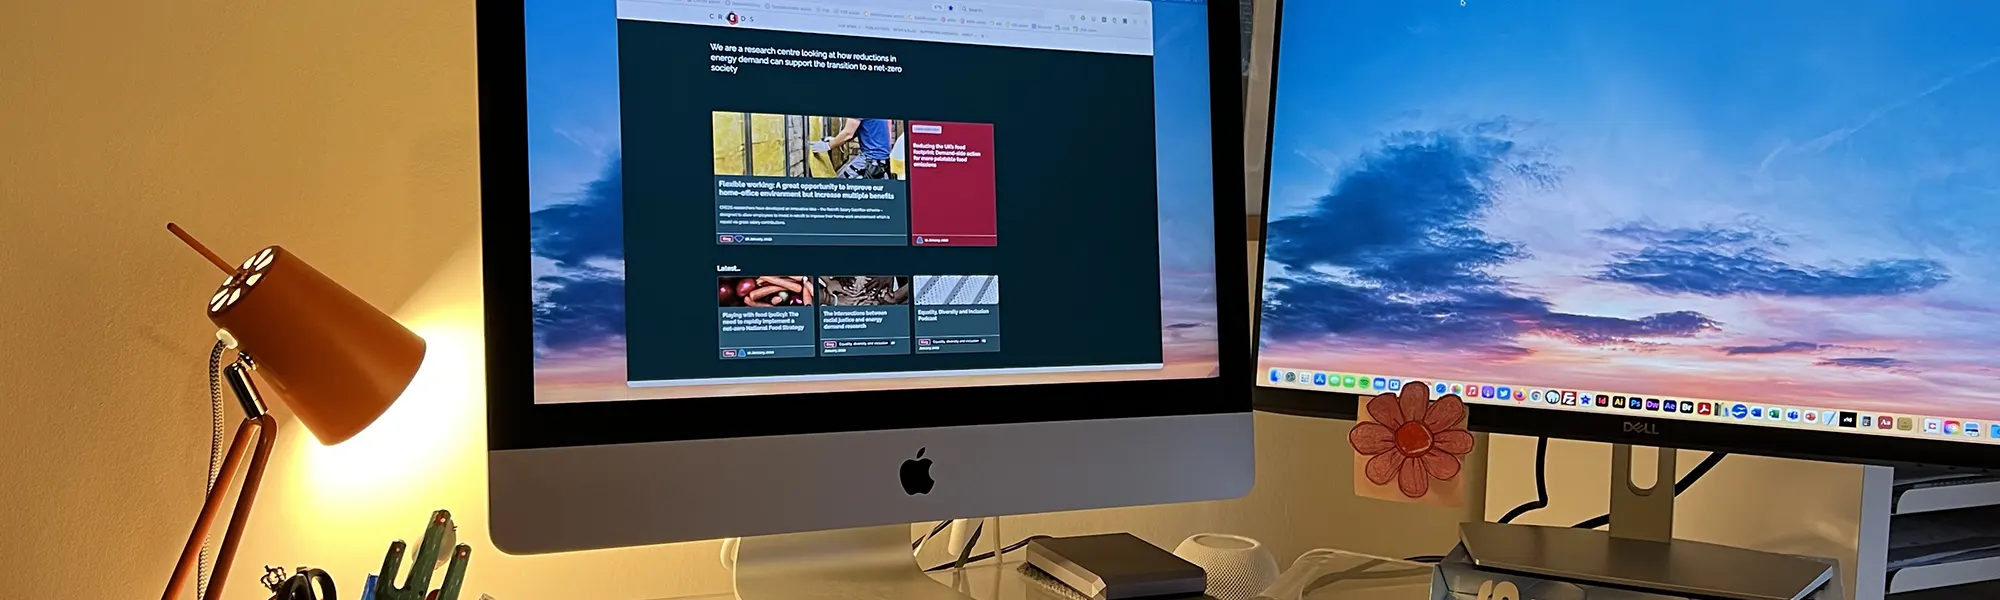
Images are the biggest contributor to data transfer on a website. The bigger the image, the more data is transferred. However, images are important; they grab a user’s attention and when used properly, enhance and demonstrate the message conveyed in the copy. Most websites have what is called a hero image. A big, attention grabbing image on the homepage to entice the user into the site. It’s a big energy eater. We’ve decided to trial dropping this on our homepage. A strapline replaces the image and far less content is being pulled onto the page from elsewhere on the site (reducing data queries). Rather than showcasing eight of our latest blogs, news or reports – we now showcase five. A featured item, the latest publication and three of the latest blogs or news posts. It’s cleaner, more streamlined and, as a result, has led to our homepage achieving a score of good in terms of its carbon footprint. Throughout the site, where we can, we mostly use webp image file types (as opposed to say jpeg or png). This web specific image file type is 26% smaller in size compared to pngs.
There’s lots more that we’ve done in terms of design structure (reduced video) and backend related matters (clean code) and we will continue to explore what more we could do. As a research centre focused on reducing energy demand, our website needs to do that too.
Banner photo credit: Steph Ferguson