
Ian Philips, Jillian Anable and Tim Chatterton
A recent study carried out by CREDS researchers at the University of Leeds has found that:
- Electrically-assisted bicycles (e-bikes), if used to replace car travel, have the capability to cut car carbon dioxide (CO2) emissions in England by up to 50% (about 30 million tonnes per year).
- The greatest opportunities are in rural and sub-urban settings: city dwellers already have many low-carbon travel options, so the greatest impact would be on encouraging use outside urban areas.
- There is scope for e-bikes to help people who are most affected by rising transport costs.
Findings
e-bike carbon reduction capability
e-bike carbon reduction capability is the maximum carbon reduction we could see if people replaced as much of their car travel as they are able with e-bikes. In England this could be up to 30 million tonnes per year, equivalent to half of current CO2 emissions from cars. On average, each person using an e-bike to replace all the car journeys they are able to could save 0.7 tonnes CO2 pa. This would mark a very radical change in travel behaviour. Researchers simulated how far people are capable of travelling [1,2] and combined this with information about car use [3] in each LSOA (Lower Layer Super Output Area, which is a neighbourhood of around 1,500 people) in England. As well as reducing CO2 levels, e-bike use has other benefits including improving local air quality and health. The failure to rapidly reduce CO2 emissions from transport is a problem, but e-bikes could be part of the solution, although an overall reduction in travel demand and other technologies will also be needed to achieve a zero emissions transport system.
Recommendation:
Define e-bikes as a strategically important mode of transport within key transport policy initiatives developed in 2020. e-bike use should be incorporated into the UK Transport Decarbonisation Plan [4], local government place-based carbon reduction programmes, organisational travel plans and in post-Covid initiatives to avoid increased car-dependence.
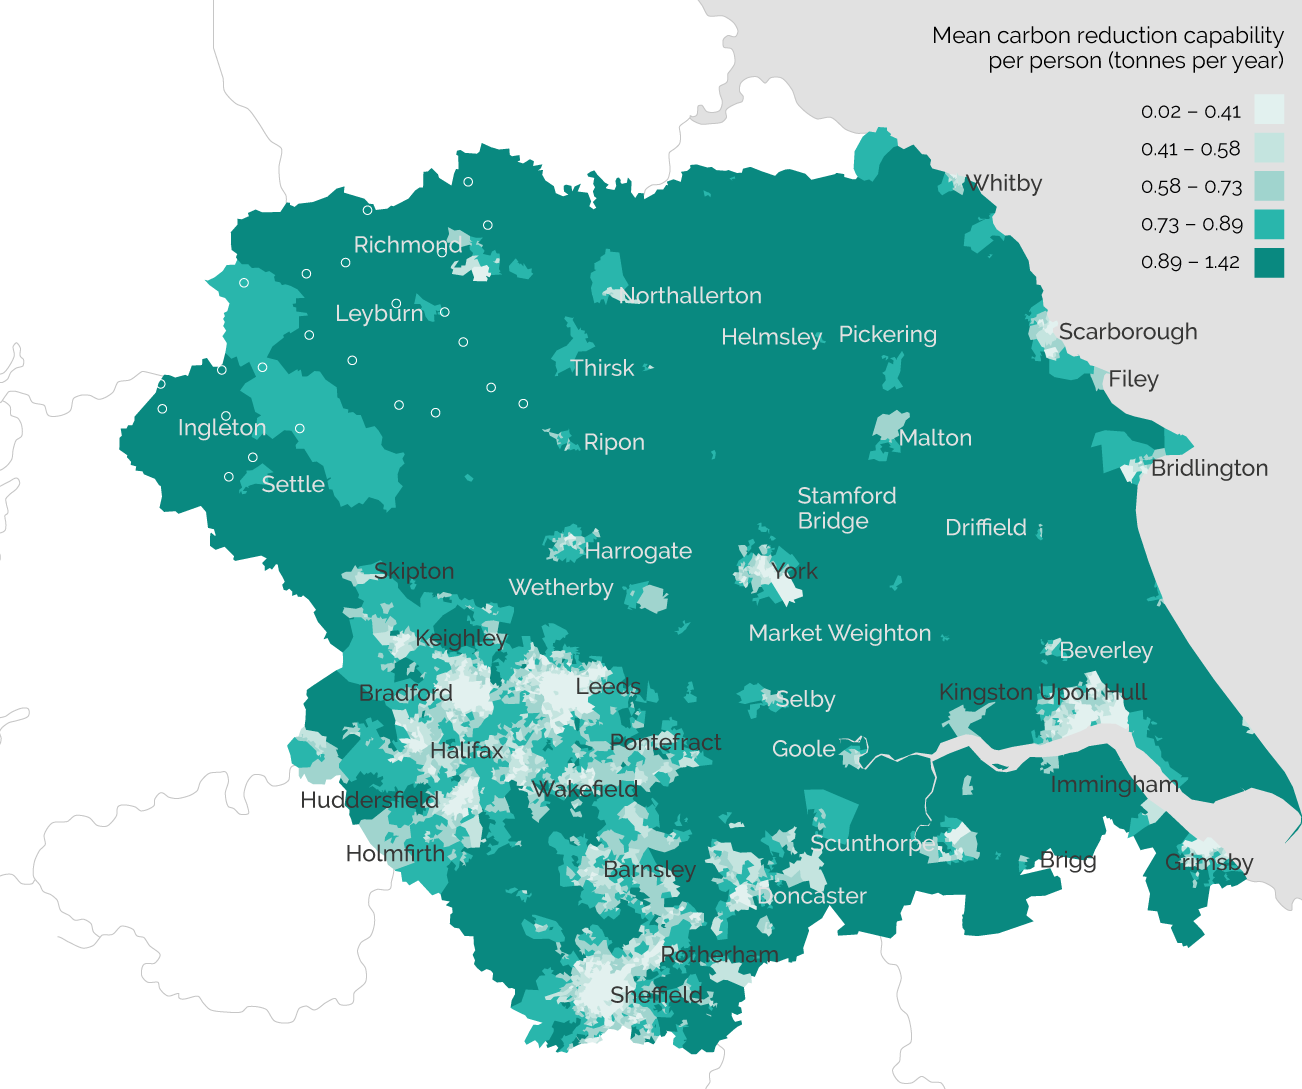
e-bikes are different to conventional bicycles. e-bikes have considerable range. We need to get out of the mind-set that only very short distance trips are possible by active modes. In Denmark they already know this.[5] They are not just building cycle/e-bike lanes in cities they are building routes from the city to the towns and villages. The highest e-bike carbon reduction capability is outside the central areas of cities (Figure 1). This is because rural areas and towns are more car dependent than big cities: car journeys are longer and there are fewer good public transport options, and in some cities there are existing bike and e-bike sharing schemes. Journeys in cities are generally shorter – services and activities are closer so walking and conventional cycling could replace a large proportion of car use. In cities, e-bikes will have relatively little effect on accessibility where public transport is good. In rural areas, in addition to poorer public transport options, walking and cycling cannot replace such a high proportion of car travel, so e-bikes have a greater net effect on CO2 reduction.
There are many practical ways e-bike use can be increased:
- The UK needs a strategic national cycle network linking villages to towns and towns to cities to facilitate access to urban areas, not just access within them. In the short term this process can begin with tactical-urbanism and tactical-ruralism for example road space-reallocation to aid social distancing, improving e-biking infrastructure, restricting car access or reducing speed limits on routes to towns to protect / enable cycling and e-biking.
- This should be backed up with monitoring and evaluation to build the evidence base for specific links. There is evidence for an e-bike subsidy scheme.[6]
- Providing e-bikes to NHS key workers may be politically popular and raise the profile of e-bike use.
- Increasing the geographic coverage of places to share and trial e-bikes such as through construction of mobility hubs can encourage uptake.
- The number of e-bikes in the UK is growing quickly, but is much lower than in many other European countries, there is significant potential for growth. e-bike promotion schemes would be good candidates for inclusion in the government’s economic recovery stimulus package.
Box 1: Cars vs e-bikes
All manner of car technologies have been proposed to solve the CO2 emissions problem. Hybrid and battery electric vehicles reduce the lifetime emissions of car travel, but not nearly so much as if replacing car use with e-bikes.
| Vehicle | Lifecycle CO2 emissions g/km |
|---|---|
| e-bike | 22 |
| Battery electric car – Nissan Leaf | 104 |
| Hybrid car – Toyota Prius | 168 |
| Petrol car – EU average | 258 |
| References 7–9 | |
Recommendation:
Include practical e-bike promotion schemes in the government’s Covid-19 economic recovery stimulus package. In the coming two years fund and implement pilot programmes that test approaches to incentivise the use of e-bikes to replace car travel. Focus on schemes outside major urban centres to maximise the CO2 reduction per person.
Reducing vulnerability to car dependence
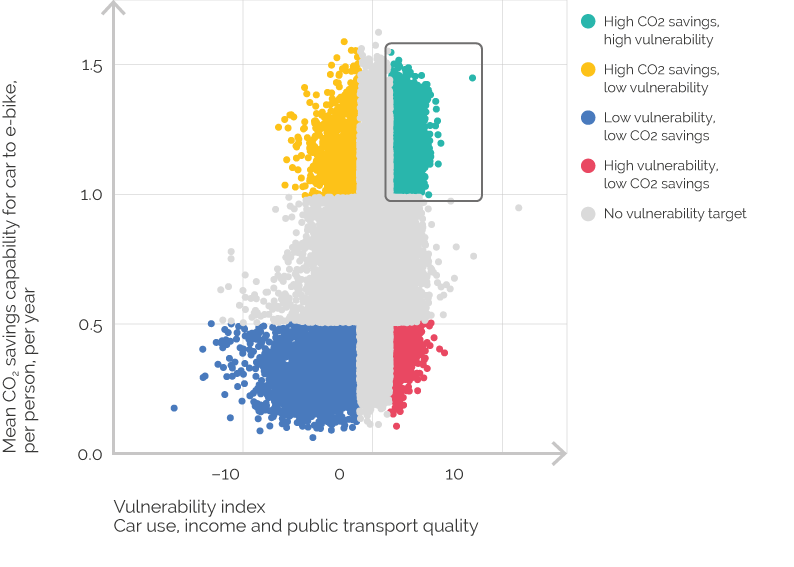
There are many neighbourhoods which are economically vulnerable to the increased costs of motoring [10] because of high levels of car dependence in the UK. Researchers used a measure of vulnerability which considered car use, income and the quality of public transport and found that there are areas which have low incomes, limited access to public transport and a high capability to replace car journeys with e-bike use. e-bike schemes here could help people to cut their transport costs (green on Figure 2). In contrast, areas which have high income and high capability to reduce car use, have high transport CO2 emissions (orange on Figure 2 shows LSOAs in both the lowest 25% of vulnerability and highest 25% of CO2 saving capability). Targeting these areas may help to generate greater CO2 savings.[11]
Recommendation:
Incentivise e-bike use in areas which are both highly vulnerable and have high e-bike carbon reduction capability. More generally, apply progressive disincentives to excessive car use where alternatives, including e-bikes, exist. As well as reducing carbon emissions, co-benefits could include improving the mobility of low income households and enhancing access to services and employment.
What change is necessary vs willingness to change
To halve the emissions of car use with e-bikes, the average adult in England would be riding around 5,000km each year. In reality this would vary – not everyone can ride that far and the model takes that into account.
Such high e-bike use may sound challenging if you look at the current level of e-biking or behavioural forecasts but radical thinking is necessary in the climate emergency. For example, one study estimated if people ride e-bikes to the same extent as people in the Netherlands do for commuting then the expected savings are a little under 1 million tonnes of CO2 per year.[12] This scenario is well beyond UK government ambition for active travel. Even more ambitious, a study in Brighton loaned out e-bikes, [13] and participants replaced approximately 20% of their private car travel with e-bike use for a variety of purposes not just commuting. Extrapolated across England this could save between 4 and 8 million tonnes of CO2 per year. As well as CO2 emissions from private car use, there are also emissions from commercial car fleets – the researchers did not include these savings in their calculations.
Many people argue that electric cars are the solution. Replacing petrol and diesel cars with electric cars will reduce the CO2 per km driven (see Box 1). However, the carbon reduction capability of electric cars depends on: how they are built, the way electricity is generated to charge them and how people use them. Electric cars may be most useful in places where public transport is poor and e-bikes offer limited capability to replace car use. Electric and hybrid cars present risks of rebound effects which undermine their improved efficiency, for example, if cheap electricity and low tax make it more attractive to drive further, or if manufacturers make bigger, heavier electric cars, CO2 reduction from efficiency savings is replaced with emissions from extra travel. Box 1 shows that e-bikes are almost 8 times more efficient than a medium sized hybrid car. To cancel out e-bike carbon reduction with rebound effects, this means people would have to ride almost 8 extra e-bike km for every hybrid car km they replace. For the average person in England that would be like e-biking from London to Leeds and back every week on-top replacing as much of their current car travel as they can with e-biking!
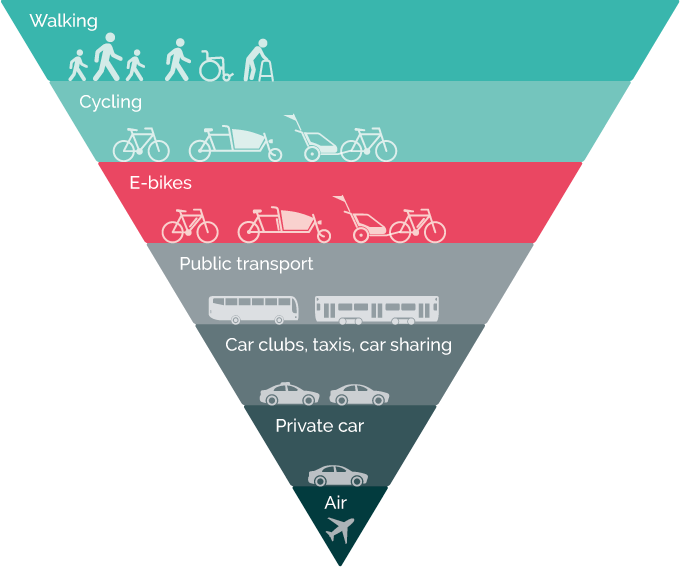
e-bikes fit into the hierarchy of sustainable transport provision
In this climate emergency we need to turn our thinking around. Policy makers need to move beyond the changes they think people would like and instead plan for a transport system which reduces its CO2 emissions as well as providing efficient, accessible mobility for all.
e-bike use has the capability to halve car CO2 emissions and improve equity, so we need to explore how much change is possible and where e-bikes can be part of the solution.
Some researchers call for climate-science-based planning for the very challenging climate mitigation agenda which we now face. If we take the Paris “well below 2°C and… pursue 1.5°C” commitment at face value, this frames a far more challenging mitigation agenda than other analysis and implies we need a 14% p.a reduction, otherwise we will use up our carbon budget by 2029.[14]
The research examined what current car travel demand could be replaced by e-bike use, but reducing total demand for car use is important too. Where e-bikes can replace a large proportion of private car use, coupled with a reduction in demand for travel, then this can help to cut car ownership and use. If demand for long journeys by car is reduced, this increases the proportion of private car use that can be replaced with e-bikes. The diagram below shows where e-bike use fits into a sustainable transport hierarchy.
References
- Philips, I., Watling, D. & Timms, P. 2018. Estimating individual physical capability (IPC) to make journeys by bicycle. International Journal of Sustainable Transportation, 12 (5): 324-340. doi: 10.1080/15568318.2017.1368748Opens in a new tab
- Philips, I. 2020. e-bike Carbon Reduction CapabilityOpens in a new tab
- Cairns, S., Wilson, R.E., Chatterton, T., Anable, J., Notley, S. and McLeod, F. 2014. Using MOT test data to analyse travel behaviour change – scoping report. ISBN 978-1-910377-01-7
- Department for Transport, 2020. Decarbonising transport: setting the challengeOpens in a new tab London: Crown Copyright.
- Hansen, K.B. and Nielsen, T.A.S. 2014. Exploring characteristics and motives of long distance commuter cyclists. Transport Policy, 35: 57–63. doi: 10.1016/j.tranpol.2014.05.001Opens in a new tab
- Newson, C. and Sloman, L. 2019. The case for a UK Incentive for e-bikesOpens in a new tab London: Bicycle Association.
- European Cyclists’ Federation. 2011. Cycle more often 2 cool down the planet! Quantifying CO2 savings of cyclingOpens in a new tab Brussels: European Cyclists’ Federation.
- Carbon Brief, 2019. Factcheck: How electric vehicles help to tackle climate changeOpens in a new tab Carbon Brief.
- Hall, D. and Lusty, N. 2018. Effects of battery manufacturing on electric vehicle life-cycle greenhouse gas emissionsOpens in a new tab Washington: International Council on Clean Transportation.
- Mattioli, G., Chatterton, T., Philips, I. and Anable, J. 2019. Vulnerability to motor fuel price increases: socio-spatial patterns in England. Journal of Transport Geography, 78: 98–114. doi: 10.1016/j.jtrangeo.2019.05.009Opens in a new tab
- CREDS Project: High energy consumers. Centre for Research into Energy Demand Solutions.
- PCT. 2019. The propensity to cycle tool manualOpens in a new tab UK: Propensity to Cycle Tool.
- Cairns, S., Behrendt, F., Raffo, D., Beaumont, C. and Kiefer, C. 2017. Electrically-assisted bikes: Potential impacts on travel behaviour. Transportation Research Part A: Policy and Practice, 103: 327–342. doi: 10.1016/j.tra.2017.03.007Opens in a new tab
- Anderson, K. 2020. Aligning UK car emissions with the Paris Agreement. Leeds: DecarboN8.
Figure 1: Map of Yorkshire and Humber region of England showing areas where the highest level of mean carbon emission reductions per person, per year could be achieved by greater use of e-bikes. It would be most beneficial in per-urban and rural areas
Figure 2: Y-axis: Mean CO2 savings capability for car to e-bike, per person, per year. X-axis: Vulnerability index – Car use, income and public transport quality. Scatter plot shows a large number of people who are vulnerable to fuel poverty would benefit from switching to electric bikes, reducing their CO2 emissions.
Figure 3: Pyramid of transport options, showing the least carbon-emitting form down to the most carbon-polluting: Walking; Cycling; e-bikes; public transport; car clubs, taxis, car-sharing; private car; air
Publication details
Philips, I., Anable, J. and Chatterton, T. 2020. e-bike carbon savings – how much and where? CREDS Policy brief 011. Centre for Research into Energy Demand Solutions: Oxford.
Banner photo credit: Alireza Attari on Unsplash