
Eoin Lees and Nick Eyre
Introduction
The UK was an early mover in understanding the scientific and political importance of climate change and on 26 April 1989, the Prime Minister, Margaret Thatcher convened a cabinet seminar. The speaker on climate mitigation was the Head of the Energy Technology Support Unit (ETSU), the late Dr Ken Currie OBE. Here we use data from the original paper which is Opens in a new tabavailable from the ECI website, pdf (9 pages, 4.7 MB) and which we refer to throughout as the ETSU89 report.
The ETSU89 report considered options that might be deployed in the UK to reduce carbon dioxide emissions over the period to 2020, i.e. a period of 31 years. It was the first significant attempt to undertake a long term projection for UK carbon dioxide emissions and the scope for their mitigation, predating both the first IPCC report on global emissions and the Royal Commission on Environmental Pollution report in 2000. By modern standards, the data available and analysis were limited. However, the task of considering options for climate abatement over a 30-year period has an obvious resonance with the current focus on the ambitious mitigation target for 2050. It is already evident that 2020 energy use will be greatly affected by the Covid-19 pandemic, and so not a suitable comparator in the context of long term energy trends. Thus we compare ETSU89 projection to 2019 with actual 2019 data.
This summary revisits ETSU89’s analysis and conclusions, compares with actual changes between 1989 and 2019, and discusses implications for future 30 year scenario construction. The full paper is available from the Opens in a new tabEnergy Efficiency journal.
The energy context by 1989
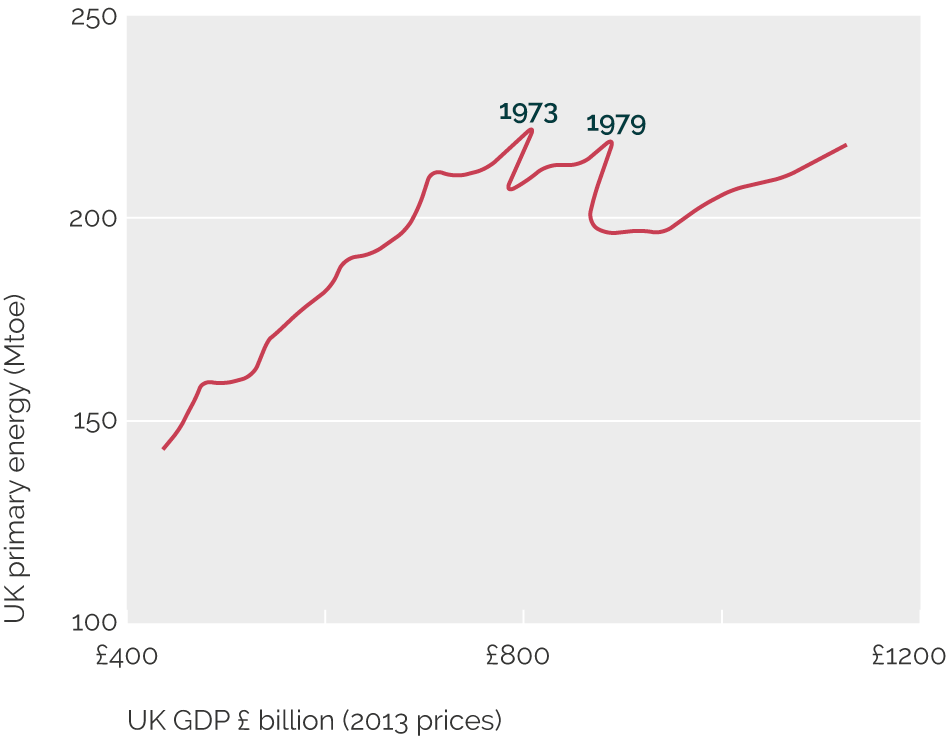
The two major rises in oil price in 1973 and 1979 had caused significant reductions in energy consumption, both by causing recessions and incentivising increased energy efficiency. Although a positive association between energy consumption and GDP was resumed after each oil price rise, the effect was weaker as shown by the decreasing gradient in Figure 1. The oil crises of the 1970s marked the beginning of more active government energy policy globally. In the UK, a separate Department of Energy (DEn) was formed in 1974.
As a result of the oil price rises, the received wisdom in energy policy from the late 70s to early 80s was that future oil prices, and hence energy costs more generally, would be on a steadily upward trajectory. Policy focus was on nuclear and coal.
The Sizewell B enquiry into the first proposed Pressurised Water Reactor (PWR) in the UK began in January 1983. The received wisdom on future energy prices had a major impact on government thinking and evidence to the enquiry. In 1982, the DEn produced three scenarios on the future costs of electricity and other fuels to 2010 and all anticipated significant future increases in energy prices.
After the second world war and until the late 1980s, the UK energy industries were nationalised, with the exception of the oil and upstream gas industries. In 1982, Nigel Lawson (then Secretary of State for Energy) decided to move energy policy to a strongly market based framework. This policy changed the role of DEn from planning energy provision and supply through state monopolies to one of the Government setting a framework for the energy market to operate.
At the time of ETSU89, the 1975 EU Directive that banned the use of natural gas for power generation was still in force. Its repeal in 1991 stimulated the so-called “dash for gas” in electricity generation in Britain in the 1990s.
By 1989, the UK Government still considered coal and nuclear power to be the likely main contributors to electricity generation until 2010. However, cracks in the argument were appearing. The difficulties that would be faced by nuclear power in attracting private finance were already becoming apparent. It was also already known that coal generation would be affected by the growing environmental concerns over acid emissions of NOx and SO2, due to the 1988 EU Large Combustion Plant Directive.
It was into this energy policy context that climate change became an emerging issue. Prime Minister Margaret Thatcher instigated a seminar on the issue in Downing Street for the Cabinet on 26th April 1989. There were presentations by Professor Tom Wigley, Climatic Research Unit, University of East Anglia on “Scientific Assessment of Climate Change and its impacts” and by Dr Ken Currie, Head of ETSU on “Options for Mitigating the Greenhouse Effect”. Also present was the UK’s UN Ambassador Sir Crispin Tickell who was a strong advocate of international action on climate change.
Background to the 1989 ETSU Report
ETSU was established in 1974, to support the DEn and based at the Harwell Laboratory of the UK Atomic Energy Authority. Early on, a unit known as the Chief Scientist’s Group was established at ETSU to assist the DEn’s Chief Scientist in assessing the technical, economic, environmental and strategic implications of various energy policies or technology strategy options.
In 1985, ETSU began one of its periodic assessments of RD&D programmes for DEn (published as UK Energy Paper 54) which provided a realistic assessment of the cost-effectiveness of the wide range of possible energy technologies and future energy options.
The ETSU89 presentation on mitigation was developed quickly in early 1989 by a small team, of which the authors of this paper were part. It drew on its analysis for UK Energy Paper 54 and ETSU’s practical knowledge from management of the UK programmes on energy efficiency and renewable energy.
Methodology of the ETSU89 Report
The methodology of ETSU89 was to consider individual mitigation options already identified within ETSU work and likely to make a significant contribution to the UK energy system by 2020. The report used the economic assessment of the 1986 Energy Paper 54.
ETSU concluded that there would be no significant contribution to CO2 reduction by 2020 from the following technologies:
- nuclear fast reactors
- nuclear fusion
- wave power
- conversion of coal to synthetic natural gas
- conversion of coal to synthetic liquid fuels
In retrospect, all of these judgements were clearly correct.
For those technologies which were deemed likely to contribute to UK energy production and consumption by 2020, the ETSU89 report evaluated total mitigation savings potential by 2020. Given the dominance of CO2 emissions from energy use and ETSU’s particular expertise in energy production and consumption, ETSU focused exclusively on a reduction of CO2 emissions, as opposed to other greenhouse gases. The first task was to estimate how much ‘business as usual’ carbon dioxide might be emitted by 2020.
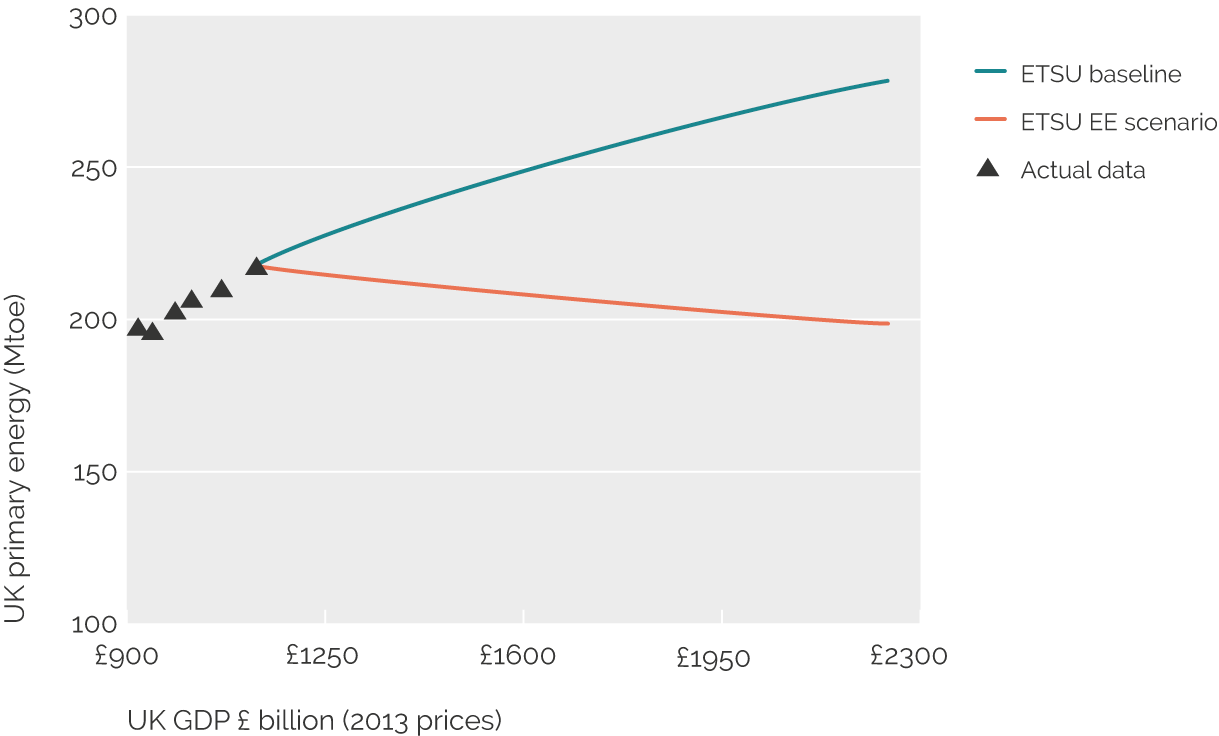
For the business as usual (bau) projection, ETSU took the most recent energy intensity (energy per unit of economic activity) for each sector and fuel and projected the trend forwards assuming the UK’s historic average annual GDP growth rate of 2.25%.
ETSU89 then developed an energy efficiency (EE) projection for the energy intensity that conceivably could be attained by 2020. This drew on a series of ETSU studies which had highlighted the enormous potential for reducing the energy required to provide energy services in all end-use sectors. The two projections are shown in Figure 2. It should be noted that the energy efficiency projection projected a falling demand for energy consumption by 2019.
The future energy requirement of the energy efficiency projection was converted into a carbon dioxide emissions figure by 2020. Based on the analysis of the 1988 Toronto Conference, ETSU assumed that it would be necessary to cut UK emissions by 50% by 2020, from 1988 actual levels. This required a reduction to annual emissions of 303 Mt CO2 in carbon dioxide emissions from 1988 emissions by 2019. Options for reducing emissions were considered individually against this business as usual projection.
ETSU89 Appraisal estimates of potential CO2 saving and comparison with 2019 outturn
For the details of the calculations and full reference sources, the published document should be read. There section 5 shows how the eight options identified in the ETSU89 report were quantified and section 6 compares the ETSU options for CO2 savings by 2019 and 2019 outturn. The data used for 2019 outturn are taken from BEIS publications available by August 2020.
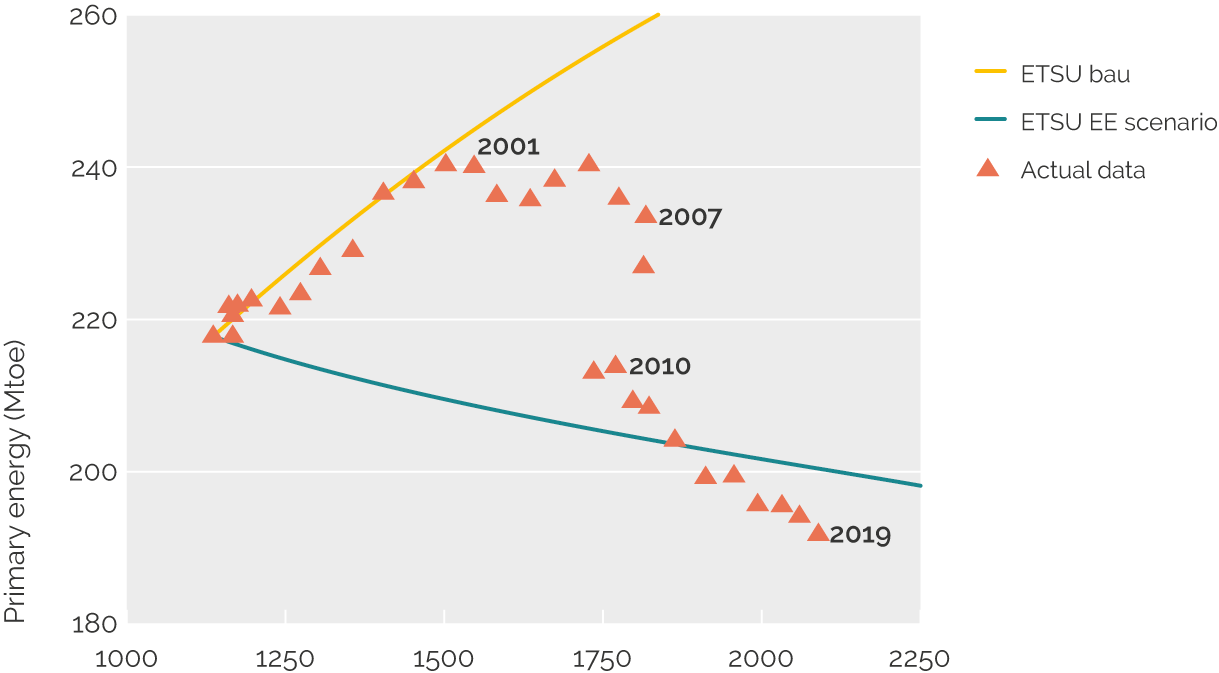
A comparison between the ETSU89 report’s projections on energy intensity and the outturn using the latest BEIS data are shown in Figure 3. UK GDP has grown at an average of 1.97% per year rather than the assumed 2.25% per year in the period 1989 to 2019. As a result, GDP in 2019 is 8% below the ETSU89 report projection and explains the mismatch of the actual data and ETSU EE projection in Figure 3.
Until 2000, energy efficiency improvement was broadly in line with the ETSU business as usual projection; total primary energy demand fell 20% from the 2005 peak by 2019 and is 6 Mtoe below the ETSU89 energy efficiency projections.
BEIS data for energy and CO2 are summarised in Table 1.
| Final energy use | Units | 1988 | 2019 | Change |
|---|---|---|---|---|
| Primary Energy | Mtoe pe | 217.7 | 191.7 | –26 |
| Total final energy use | Mtoe | 148.6 | 142.0 | –6.6 |
| Electricity final end use | TWh | 274.5 | 276.8 | 2.3 |
| CCGT electricity supplied | TWh | negligible | 129.5 | 129.5 |
| Renewable electricity supplied | TWh | 5.2 | 114.3 | 109.1 |
| Coal & Oil electricity supplied | TWh | 225.0 | 7.5 | –217.5 |
| Nuclear electricity supplied | TWh | 55.6 | 51.0 | –4.6 |
| Carbon Dioxide Emissions | Annual | 1988 | 2019 | Change |
| All energy | MtCO2 | 590 | 351.5 | –238.5 |
| Electricity generation | MtCO2 | 197 | 57.4 | –139.6 |
| Other energy related | MtCO2 | 393 | 294 | –99 |
| CO2 content of electricity | kgCO2/kWh | 0.74 | 0.19 | –0.55 |
In Table 1, the most notable change is the near elimination of coal and oil fuelled electricity supplied to the grid. The increase in UK renewable energy generation has been remarkable and it supplied the electricity grid with 114.3 TWh in 2019 growing from 5.2TWh in 1988, which was largely from hydro plants. The nuclear electricity supplied to the grid has slightly dropped from 55.6 TWh in 1988 to 51.0 TWh in 2019.
The CO2 emission reductions from UK electricity generation and other energy uses are 139.6 Mt CO2 and 99 Mt CO2 respectively. The BEIS data imply that in 2019, electricity delivered to final users had an average carbon emissions value of 0.19 kgCO2/kWh, compared to a 1988 value of 0.74 kgCO2/kWh.
Allowing for the zero emission generators in 1988 (nuclear and hydro), this implies that coal and oil fuelled electricity to final users in 1988) had an average carbon dioxide emission of 0.88 kgCO2/kWh.
The reduction from actual 1988 emissions required to meet the 50% target reduction set out in the ETSU89 report would have required a reduced annual emission rate by 2019 of 303 MtCO2. The 2019 actual UK CO2 emissions are provisionally 351.5 MtCO2, implying a shortfall of 48.5 MtCO2 from the ETSU89 report mitigation target.
For the CO2 savings from CCGT gas replacing coal and oil fired generation, we have multiplied the increase in CCGT electricity supplied to the grid in 2019 by the difference between the 1988 fossil fuel figure of 0.88 kgCO2/kWh and the CCGT figure of 0.37 kgCO2/kWh in 2019. For the CO2 savings from renewable electricity supplied to the grid, we followed a similar approach but with zero emissions from renewable electricity.
As well as making substantial cuts to CO2 savings, CCGT and renewables have also made a significant reduction in primary energy due to their greater generation efficiency. Therefore to measure the CO2 savings from end use energy efficiency, we focused on final energy consumption in 2019 compared to the ETSU business as usual projection. ETSU89 assumed all cost effective energy efficiency measures in 1988 would be installed by 2020: insulation; lighting; motors & drives; appliances; Building Regulations; process control; road transport; CHP. The BAU projection drew on the 1983 to 1988 trends in end use energy with final energy demand assumed to grow annually by 1.2%, 1.6% and 0.5% for transport fuels, electricity, and heating fuels respectively. The different rates of increase were based on past data and reflected expectations about structural changes in the economy away from heating towards transportation and services provided by electricity.
Figure 4 shows the differences between the mitigation potentials identified in the ETSU89 report for the 8 possible CO2 reduction options and their actual impacts by 2019.
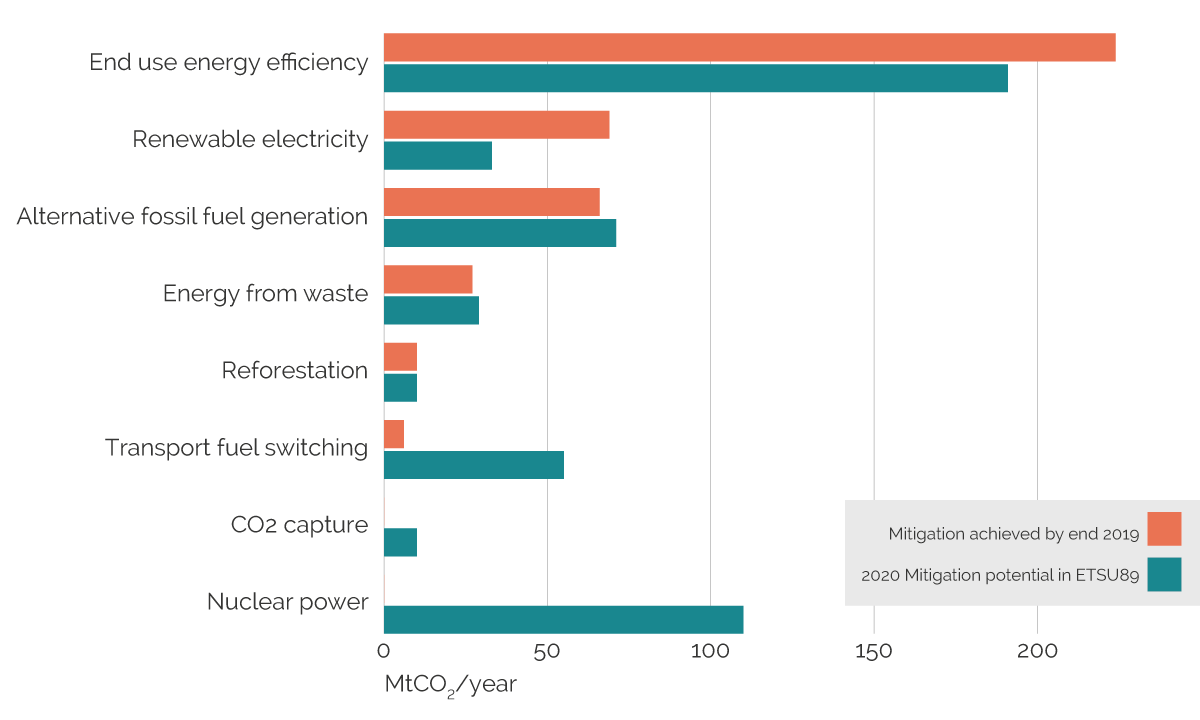
It is clear that energy efficiency improvements have been the major contributor to emissions reduction across all forms of energy use. The largest absolute reductions in energy demand have been in heating fuels a 34% reduction compared to ETSU89 bau; this has saved 68 MtCO2. However, electricity efficiency improvement has contributed more to carbon emissions reduction, because of the higher CO2 emissions factor of electricity in 1988; a 32% reduction compared to ETSU 1988 bau has saved 129 MtCO2.
Despite considerable increases in annual vehicle mileage since 1988, the increase in CO2 emissions from road transport has been modest at 5.4 MtCO2. This is primarily due to improved vehicle energy efficiency, through increased diesel usage and improved engine efficiency. The switch to diesel cars has been much faster than the 1989 ETSU report envisaged. Road vehicle efficiency improvements have produced a 16.5% reduction in energy demand compared to ETSU 1988 bau projection and saved 33 MtCO2.
Since 1990, the increase in land use CO2 sequestration has been 9.3 Mt CO2, so the improvement from 1988 is probably around 10 Mt CO2. This is very similar to the mitigation potential of 10 MtCO2 set out in the ETSU89 report, although the latter figure was solely for 10% of land reforestation.
For heat and power from waste, ETSU89 assumed that 50% of waste streams would generate heat and power, mainly from landfill or anaerobic digestion (including chicken litter) with smaller straw and municipal incineration contributions. In 1988, landfill gas and sewage gas provided 0.4 TWh electricity to the grid. By 2019, generation from bioenergy which includes these sources plus energy crops had increased to 31.5 TWh. We exclude incineration of municipal waste, tyres etc. (5.9 TWh in 2019) as this has not been counted as a renewable energy source in UK Government statistics since 2013. Eligible electricity from waste has saved 27.4 MtCO2. We are not able to quantify exactly the CO2 savings in renewable heat from waste, but that has probably saved up to 10 Mt CO2.
ETSU89 excluded EVs and hydrogen fuels, but assumed some form of gas for all vehicle types. In practice, CO2 savings from transport fuel switching have come from using biofuels in road transport rising from negligible levels in 1988. By 2018, ethanol was 1.6% of total road transport fuel and biodiesel 3.4%; LPG and natural gas consumption remain negligible. The CO2 savings in 2019 were, for bioethanol 1.65 MtCO2, and for biodiesel 4.04 MtCO2, so a total of 5.7 MtCO2 overall saving from transport biofuels. The ETSU89 report did not anticipate that EU legislation in 2009 would require Member States, by 2020, to source 10% of petrol and diesel from biofuels.
For directly generated renewables, ETSU89 assumed a median figure from Energy Paper 55 with a contribution growing from 4.8 TWh/year to 40 TWh in 2020. In 2019, 82.8 TWh were generated by renewables, primarily from wind (onshore and offshore). The additional 78 TWh of renewable generation achieved by 2019 results in an estimated saving of 68.6 MtCO2. The reasons for ETSU’s under-estimate was the failure to anticipate the dramatic drop in costs of wind and photovoltaics and also the active policy support for their deployment. Additionally, electricity wholesale market reform that enabled low-risk contracts for investors has been critical, especially for offshore wind.
ETSU89 assumed one commercial demo of CO2 capture & sequestration would be built by 2020 using the captured CO2 for enhanced oil recovery. The proposed demo scheme in 2015 did not proceed, and therefore there has been no contribution to emissions reduction.
ETSU89 assumed nuclear power would provide 50% of electricity generation by 2020 and that 24 PWRs would be built by then. No nuclear power plant construction has been completed in UK since Sizewell B was commissioned in February 1995. The 2019 annual load factor for nuclear dropped to 62.9% resulting in the energy supplied to the grid in 2019 by nuclear power being 56 TWh, which represents a decline of 4.6 TWh from 1988. This was clearly the biggest single mitigation potential identified in the ETSU89 report which has not been delivered.
The ETSU89 report envisaged significant contributions to emissions reductions from a range of alternative methods of fossil fuel generation, including cleaner coal technologies and cogeneration. In practice, fuel switching to natural gas combined cycle gas turbines has dominated. Gas-fired power stations generated 129.5 TWh in 2019 compared to a negligible amount in 1988. So CCGTs have saved 66.0 MtCO2. Electricity from CHP plants which do not use renewable fuels in 2019 is less than 4% of the CCGT generation figure.
It is clear that natural gas has taken a much bigger share of the market than envisaged in the ETSU89 report. A critical factor has been the EU and subsequently UK legislation that allowed natural gas to be used as a fuel for electricity generation. Coupled with the liberalisation of the GB electricity market, new entrants chose to build low cost capacity quickly and prompted the “dash for gas” in power generation. Coupled with increasingly stringent constraints on acid emissions from coal-fired power stations, this has resulted in coal fired generation coming out of the electricity mix quicker than anyone anticipated in 1989.
Conclusions
Projecting forward expectations of energy production and demand is a difficult exercise and the ETSU89 report attempted to project forward 31 years. Improvements in energy efficiency have made the largest contribution, ultimately achieving more than set out in the ETSU89 report, although implementation of energy efficiency on a significant scale lagged till 2005.
Low carbon electricity has provided the second largest contribution, although the balance between nuclear and renewable contributions has been very different from what was expected in 1989. We put this down to two factors. First, the commitment in UK Government to a major new nuclear programme of Pressurised Water Reactors ultimately proved incompatible with the policy commitment to a liberalised electricity market. Second, there has been a rapid rise in the role of renewables for direct electricity generation in the last five years due to the falling costs of renewables. The ETSU89 estimated potential of 40 TWh/year was not exceeded until 2014, but that contribution has now more than doubled.
The successful low carbon policies for energy efficiency and renewable energy adopted by the UK since 1988 have been driven by different policy and regulatory levers, which can be broadly divided into three categories.
The first category is policies driven by UK Government. These include specific regulatory interventions in buildings, notably the requirement for all replacement boilers to be condensing from 2005, which alone gave a 25% improvement in energy efficiency. Early privatisation and regulation of the energy sector in the 1990s prompted the UK to be the first country in the world to use Energy Efficiency Obligations (EEOs) on electricity and gas companies in liberalised markets from 1994. Some financial support schemes for renewable electricity in the UK also pre-dated EU level drivers.
The second categories are policies driven by EU Directives, but with discretion for the UK to adopt the policy or regulatory mechanisms. In the buildings sector, the Energy Performance of Buildings Directive (1996) has shaped buildings regulations in all parts of the UK and the EU. The Energy Efficiency Directive (2012) established an explicit energy saving target for all member states. The Renewables Energy Directive (2009) set explicit targets and rules for to Member States, including a 15% renewable energy contribution for UK total energy needs, which has proved very influential in driving UK renewable energy policy.
The third category is EU Directives related to traded goods which have direct EU wide requirements. The Energy Labelling Directive (1994) paved the way for differentiation between “good” and “bad” energy using products in terms of their energy efficiency. While the initial direct impact on consumer decision making was modest, the label underpinned many of the EEO activities in the UK. The Ecodesign Directive (2009) including minimum energy performance standards for energy using products has had a large impact in securing absolute reductions in appliance electricity use. Similarly the Vehicle Labelling Directive (1999) enabled the introduction of mandatory standards for new vehicle fuel economy from 2015. This has proved effective although it is well-documented that actual fuel economy has not matched test data.
Now that the UK has left the EU and the European Single Market, it is clear that in planning for a future net zero UK, more attention will need to be paid to those policy areas in which EU Directives previously shaped progress. This applies particularly in the field of energy using products in which EU policymaking has been central. The UK market is small compared to the EU, and the domination of most markets by multinational manufacturers is likely to make the creation of separate UK product lines uneconomic. Maintaining the undoubted benefits that UK energy efficiency has had from these EU directives points towards retaining close alignment in such standards.
A big missing element in the 1989 ETSU report’s analysis was the neglect of political and institutional change. Most importantly, the analysis did not allow for gas-fired generation, as it was not legal at that time under European Law. However, this is not an adequate excuse; laws and governments are just as susceptible to change as technologies, and should be allowed for in foresight exercises. Our analysis shows that changes in legislation, environmental considerations, technical innovation and market mechanisms all play a part in determining climate change policy. For example, the decline of coal has been driven by natural gas eligibility as a fuel and acid emissions legislation; the rise of renewable electricity by explicit legal requirements and early entry financial support; the rise in biofuels for transport by explicit legal requirements; energy efficiency improvements by regulatory energy efficiency obligations on energy suppliers.
By revisiting this work from 31 years ago, we can draw some relevant conclusions for the very much larger body of analysis now being undertaken for the next 30 years of climate mitigation in the UK.
Discussion
First, the central role of energy demand
The major success of the ETSU89 report was that it correctly identified energy efficiency improvement as likely to be the biggest contributor to climate mitigation over the following 30 years. Major contributions were projected to come from efficiency improvement across the economy and this is what has happened. Although perhaps uncontroversial now, it was viewed with suspicion within government and much of the energy industry in1989.
Linked to electrification of many other end uses, energy efficiency and demand side management should be the dominant approach to thinking about decarbonisation. Yet, current UK Government policy set out in the Clean Growth Strategy in 2017 still presents energy supply as the primary instrument of climate mitigation. Energy efficiency policies have been weakened since the period of their major success from 2005 to 2012 and it seems highly unlikely that decarbonisation at the rate hoped for can be achieved without reversing this decline, as without a reduction in the energy required for energy services, energy bills to end users will rise.
Second, the role of small-scale, mass-produced technologies
In the ETSU1989 report, the dominant approach to innovation was focussed on what RD&D might achieve to reduce costs. There was little attention to cost reduction in production as there was no significant use of the learning curve concept in energy policy until early 2000s.
The lessons of the last 30 years are that cost reductions can be significant and even dramatic when the technology is manufactured in the millions. Progress in wind and PV technology has exceeded expectation. There are similar examples in energy demand technology – light emitting diodes (LEDs) now dominate sales of new lighting despite being an unproven technology in 1989 and product regulation has continually lowered the standby electricity consumption of electrical goods and improved the efficiency of gas boilers. The energy efficiency of information, entertainment and communication equipment has also been markedly improved in recent years.
However, such progress in cost reduction is not universal. Much of what was written in 1989 about nuclear fission, fusion, large tidal barrages, wave energy and CCS could be reproduced today without much amendment. In general, technologies dependent on large engineering projects have demonstrated less opportunity to progress and learn from experience than mass-produced manufactured technologies. Such lessons need to be heard in current debates.
Third, progress is not just a matter of technical change
The adoption of legal and regulatory measures has been critical to delivering progress in UK climate mitigation. In some cases, this has been achieved via highly visible and popular measures such as the PV feed in tariff, which enabled solar generation on one million buildings and the development of many community energy initiatives. In other cases, such as the Building Regulation requirement for gas and oil boilers to be condensing, the change has been almost invisible outside the relevant industry sector.
In the next 30 years, the way energy is supplied and used will need to be more radical than in the last 30 years, if the net zero target is to be reached. This will require social change and political leadership. However, there is cause for optimism. For example, community energy which aims to put people at the heart of the energy system was unknown 20 years ago. Over 5,000 community energy groups in UK have now built local projects on renewable electricity generation, energy efficiency, heat networks, energy supply arrangements and energy storage; all are either wholly owned and/or controlled by communities or through partnership with commercial or public sector partners. There are also signs of political movement; for example, Scotland has the goal of reaching 2GW of renewable energy capacity in local ownership by 2030. What can be achieved remains uncertain, but the key lesson from the last 30 years is that change is possible.
Acknowledgements
The authors gratefully acknowledge the contributions of ETSU colleagues to the ETSU89 report: the late Ken Currie, Beth Taylor and all other members of ETSU’s Chief Scientist’s Group in the 1980s.
Publication details
Lees, E. & Eyre, N. 2021. Thirty years of climate mitigation: lessons from the 1989 options appraisal for the UK. Energy Efficiency, 14: 37. doi: Opens in a new tab10.1007/s12053-021-09951-2 Open access
Banner photo credit: Alireza Attari on Unsplash