CREDS researcher, Tadj Oreszczyn is leading a project to monitor the impact of COVID-19 on domestic energy use and reflects in this blog on why Milton Keynes has fared so well during the pandemic.
Like many I have been working exclusively from home since March 2020. When asked how things are, I jokingly say, little has changed, Milton Keynes naturally self isolates. Everybody drives around in tin-cans and we have so many paths and parks that we don’t have to meet others. And of course, there is no scientific evidence that concrete cows or roundabouts spread COVID-19.
So how has Milton Keynes (commonly know as MK) survived COVID-19? From a health perspective it has lower than average cases (356 per 100,000 population compared to England 507), and death rate (39.3 per 100,000 compared to England 65.4). Many Epidemiological PhD’s will I am sure be written on the impact that low density urban form has on the spread of disease. However, separating the cultural and social from the physical infrastructure will be complex. COVID-19 probably entered MK via the large number of London commuters, or skiers returning from Italy, MK is a taxi ride from Luton airport.
Car and cycle focused
MK is car and cycle focused, designed with 225 km of dedicated cycling lanes (called redways because of their colour) which during COVID helped many enjoy bike exercise. Only serious road cyclists venture on the city’s roads. MK cyclists are incredulous that anybody would design a cycling system for 10 mph when most cyclists are travelling much faster. As somebody said when I first moved to MK “the best thing about MK is it’s easy to get out of”. So serious cyclists head for the country lanes. During lockdown, families started to appear on these lanes, however it was not long before white delivery vans, who own the roads, started to reclaim them. More recently, autonomous delivery robots and electric scooters are starting to take over our redways!
During lockdown for the first time you no longer heard the background hum of the grid roads, instead you heard the birds sing. Road traffic is now back to normal. We do not have the usually bumper to bumper rush hour as the city was designed for 2 cars per home and the grid system and 130 roundabouts alleviates congestion, allowing traffic to move more freely. We complain if it takes more than 15 minutes to get anywhere in the city. The low density and fast moving traffic is thought to disperse pollutants making MK one of the cleanest urban areas in the UK.
Energy use in buildings
What about building energy use? MK is different from other places in terms of the breakdown of its built stock. Also, we have a lower density of occupancy than most towns. This would normally signal high energy use, but in the case of MK we have a relatively efficient stock because of our newer homes and MK pre-empted the energy building regulations. The modern MK homes use 7% less gas and 3% less electricity than on average in the UK, despite houses being bigger than the UK average and the people being wealthier.
I was surprised to visit the Middle East a few years ago while researching energy efficient buildings and shocked to find that people did not only know Manchester United, but also Milton Keynes, as several families owned summer homes in the city (MK is not actually a city but residents here have always called it one). The attraction being the safe and clean environment, escaping 45C summer heat and easy access to London with it’s designer shops. Surprisingly, a PhD student, Badria Jaffar I was lucky enough to supervise, recently discovered that the energy intensity of a Middle East (ME) home was similar to a UK home. Both have similar temperature differences but in MK we heat, whereas they cool, although we have more insulation, they have more efficient cooling systems than our heating systems. The ME house does, however, use more energy because of the bigger homes. Badria also found that ME homes could significantly reduce the strain on their electricity system if they turned down the cooling system while they are on vacation to places like MK. Just like we leave the heating system on during our Christmas holidays to prevent pipes freezing, they keep the AC on to stop the plastic melting in their homes! Of course, COVID-19 has put a stop to these vacations.
MK also has a very different non-domestic building stock to most cities, it has one of the highest non-domestic volumes and these are not mixed up as in many cities, see figures below. I guess this is what you would expect in a well-planned city. The city has a lot of warehouse units, 55% by volume of the non-domestic stock, compared to other cities like Leicester which only have 30% and Swindon 36%.
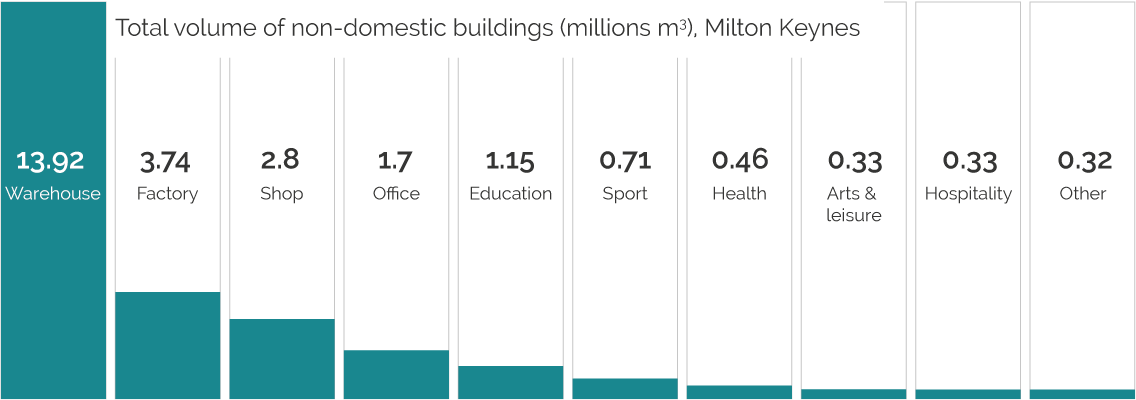
Figure 1: Total volume of non-domestic buildings (milliions cubic metres) in Milton Keynes. Data created using a tool developed as part of CREDS called 3DStock – thanks to Rob Liddiard for pulling the MK data together.Steadman, P., et al. (2020). Building stock energy modelling in the UK: the 3DStock method and the London Building Stock Model. Buildings and Cities, 1(1): 100–119. doi: 10.5334/bc.52.
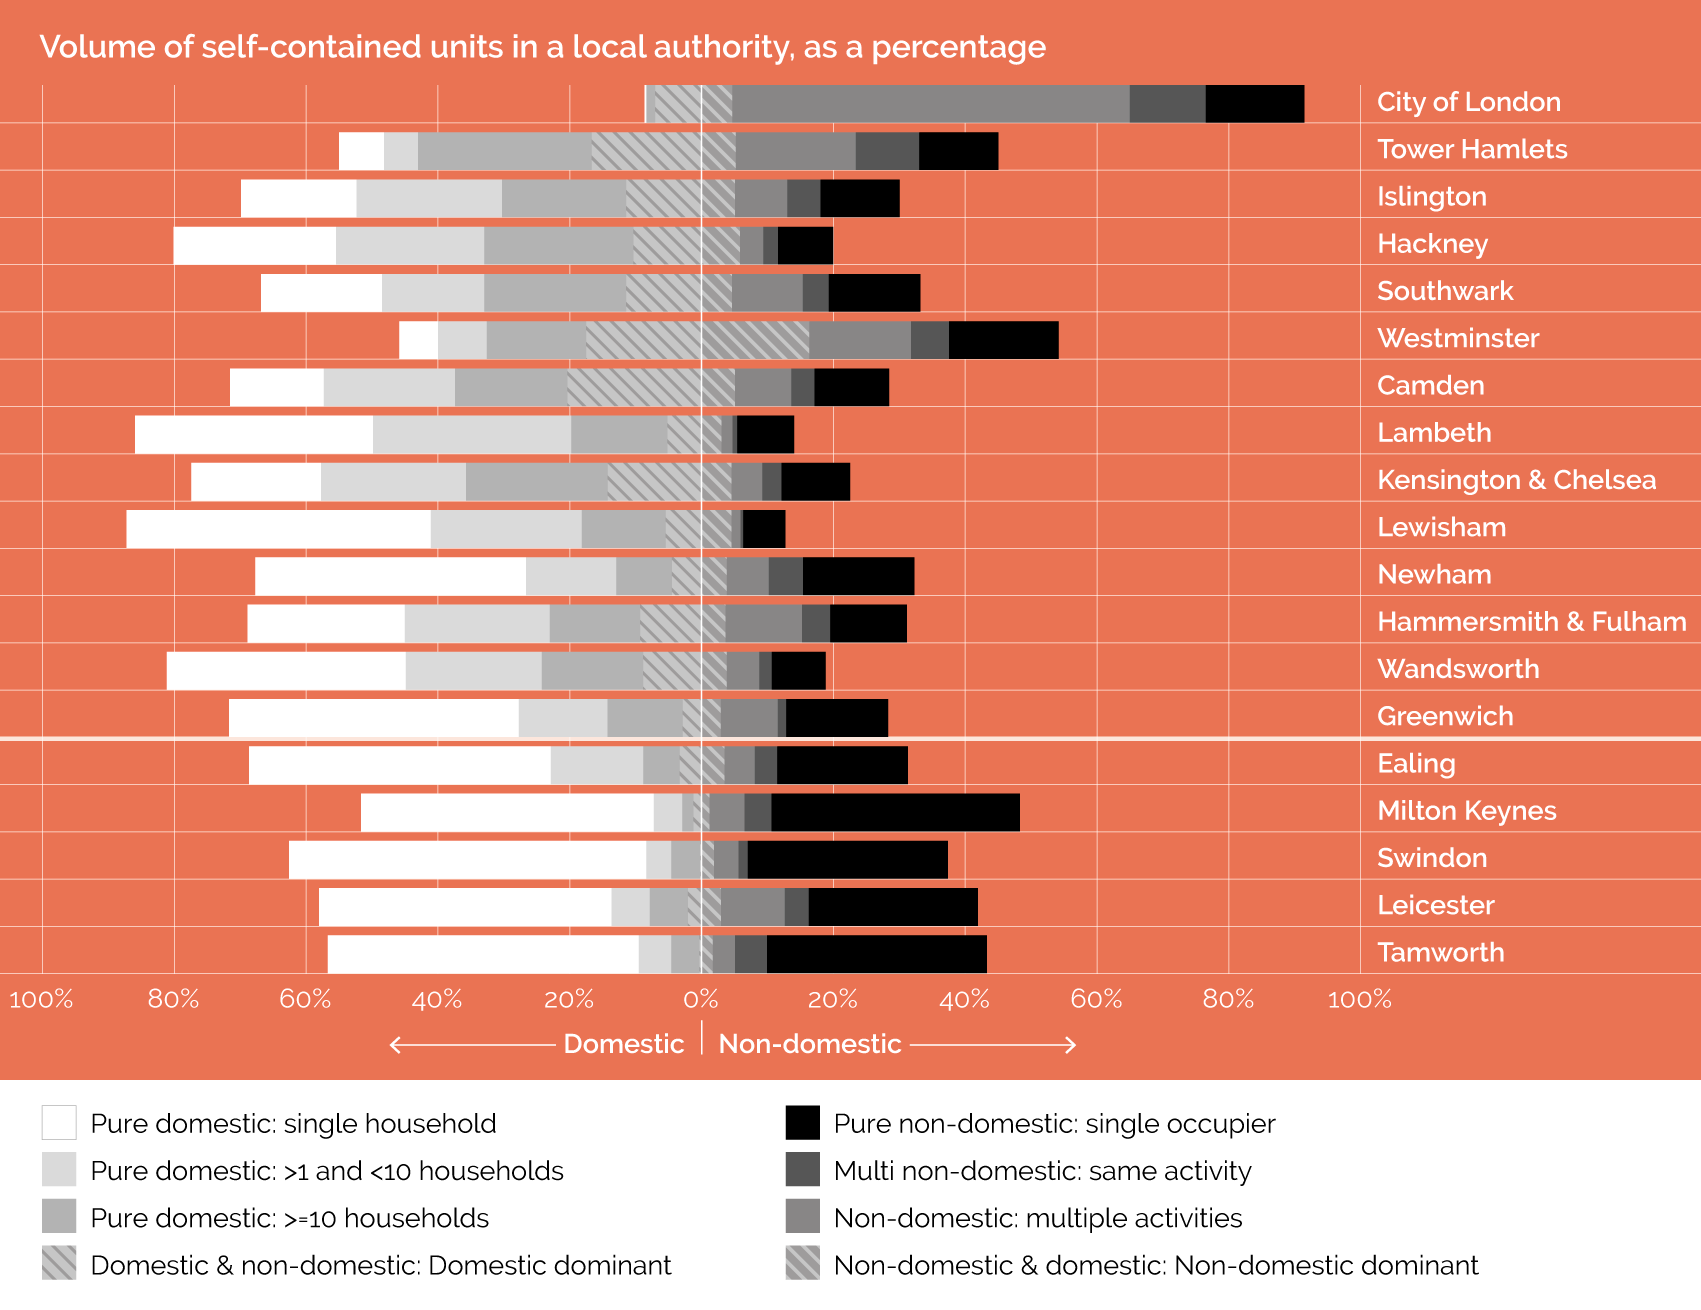
Figure 2: Total volume (cubic metres) of all self-contained unist (SCUs) in 19 boroughs and cities. Shading indicates the mixing of activities, in the catgeories shown. Diagonal shading marks SCUs in which domestic and non-domestic activities are mixed.
So, I can imagine MK will fare well post COVID, as Londoners trade in flats for cooler 3 beds in a greener MK. Somewhere you do not need to travel by public transport. Plus, a booming warehouses sector with great transport links, at a time when warehouses have become some of the “hottest assets in real estate”. It looks like concrete cows and roundabouts may have finally become attractive!
By Tadj Oreszczyn. Tadj leads the CREDS Building and Energy Theme and is also leading a project to monitor the impact of COVID-19 on domestic energy use. Thanks to UCL’s Building Stock Laboratory for providing the stock data particularly Robert Liddiard.
Data source
- Valuation Office Agency (VOA) data contain public-sector information licensed under the Open Government Licence v1.0.
- Environment Agency LiDAR data contain public sector information licensed under the Open Government Licence v3.0.
- © Local Government Information House Limited copyright and database rights 2020. Licence number RDA241 160620.
Banner photo credit: Justin Hall on Adobe Stock