
Jillian Anable and Greg Marsden
Summary
This research aims to understand the longer term behavioural responses to Covid-19 and how they varied across different areas and different socio-economic groups. It draws on a panel survey collected by the University of Leeds and the University of Stirling across 10 areas in England and Scotland. This data set has been combined with spatial data to enable the behaviour of individuals to be connected to characteristics of their local area. This report summarises the key findings relating to work from home, grocery shopping and mode use focusing on aspects of behavioural change which are most relevant for policy makers in months ahead.
The data
The survey was administered by a market research company (YouGov). The sampling approach included quotas by region, age, gender and social grade, in addition to ethnicity for London, and the data was subsequently weighted to be representative of each region. The areas covered were Aberdeen, Ayrshire, Bristol, Edinburgh, Glasgow, Lancashire, Liverpool, London, Manchester and Newcastle. The findings are generalisable to the areas sampled. However, in interpreting the findings, it is important to note that the sample is not nationally representative and has an urban bias, although it covers types of area much more diverse than central urban cores.
The survey was conducted in two waves. The first survey (Wave 1) was conducted in July 2020 and focused on behaviour in February and early March 2020 just before the first national lockdown and behaviour during the first period of national lockdown (spring 2020). The second survey (Wave 2) was in December 2020 and focused on behaviours since the initial lockdown and in October. 9,362 participants were in Wave 1 with 6,302 of the same participants continuing in Wave 2. The three time periods used for reporting results are:
- Before lockdown/Covid-19 outbreak (representing the first UK wide lockdown in February and early March 2020)
- During lockdown (representing late March to early June 2020)
- October (representing October 2020 when some restrictions had been eased)
Travel to work and working from home
When reporting on changes to patterns of journey to work or working from home we only include those people who were working in both waves of the survey.
Before the Covid-19 outbreak not working from home at all was by far the most prevalent working practice undertaken, reported by 76% of those in work in the study areas and this remained the case for 44% of workers in October 2020. Nevertheless, almost half of workers who did not work from home (WFH) before lockdown transitioned to WFH and were still doing this in October, around a third of those in work overall. Around half (55%) of those in employment worked from home some (17%) or all (38%) of the time in October.
The job sectors which accounted for the most WFH included financial services, IT and telecoms, media and marketing, accountancy, legal and real estate. Together these sectors accounted for just over half of all days undertaken WFH both before Covid-19 and in October 2020 even though they only employed 19% of the workers. The proportion of workers claiming to involve driving as a primary part of their role (e.g. taxi drivers, couriers) was between 7% and 8% before Covid-19 and in October 2020.
Car commuters were less likely to work from home before and during lockdown.
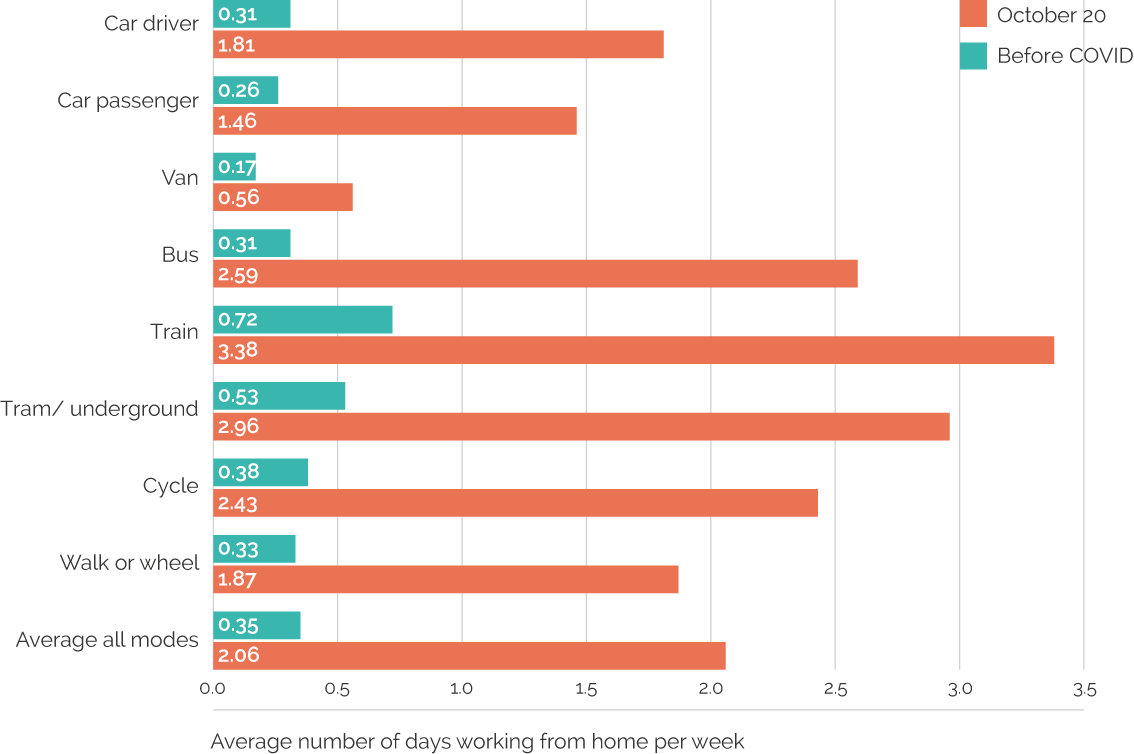
Using average number of days worked from home or the percentage of all days worked by each mode user, a clear picture emerged of car commuters being most likely to be in jobs that did not allow home working. Car driving commuters were the least likely, other than car passengers and van drivers, to work from home before Covid-19 (0.31 days a week, or 6% of total days worked by car drivers in the sample) and train commuters the most likely (0.72 days rising to 3.38 or 3% rising to 65%). The tendency for less WFH among car commuters holds strong even when those with jobs involving driving are not included in the analysis and also when London is removed from the analysis to account for the greater use of public-transport among those in job sectors more conducive to WFH.
The lower prevalence of WFH among car commuters is explained by the fact that those who did not WFH before or during the pandemic tended to live in areas that are the least accessible to employment opportunities and town centres. They were the most likely to live in areas with above average proportions of car commuting. Even though the average distance to work of those who did not work from home was shorter (10.0 miles) compared to people who started to WFH during the pandemic (13.4 miles), car commuting was relatively high (56% vs 47%) and very stable. Of those who drove to work before lockdown and had the same job in both survey waves, only 4% had moved away from the car in October. In addition, those who did not WFH before or during the pandemic had higher average car ownership than others in employment, higher overall frequency of using the car and for specific purposes such as the journey to school and to supermarkets. Those who did not WFH before or during the pandemic also lived in areas with higher levels of deprivation whereas people who started to WFH during the pandemic were more likely to live in less deprived areas, indicating a widening of the gap between average deprivation levels for home workers and non-home workers.
Before the Covid-19 outbreak, those who worked from home all of the time were more likely than partial home workers to live in areas with above average proportions of car commuting. By contrast, those who reported partial home working pre-pandemic were more likely to live in areas with greater train, underground and bike commuting. During the pandemic, partial home workers and many previous non-home workers began to WFH full time, and both groups were most likely to live in areas with better accessibility by most travel modes, as measured by shorter travel times to areas of local employment and to local services.
Rates of home working vary hugely across different areas
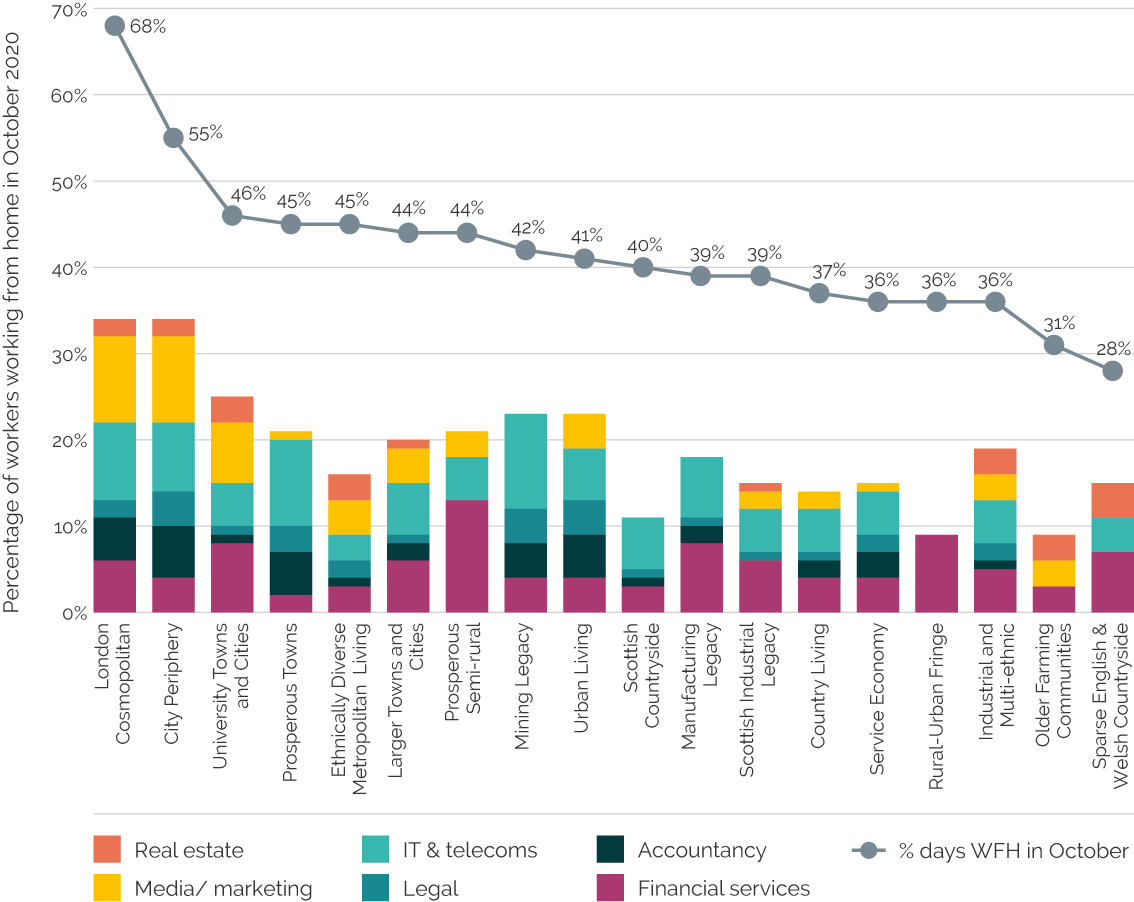
Overall, the data suggests that working from home has been widespread in all the areas studied, varying from an average of 28% of working days for people living in sparse countryside areas to 68% of those living in London cosmopolitan areas. This very different level of working from home may impact significantly on commuter traffic levels and mode share in the longer term.
Job sector has an influence on rates of WFH and explains the spatial patterning to some extent. Those Local Authority subgroups with the greatest proportion of WFH in October 2020 (London Cosmopolitan, City Periphery, University Towns and Cities) also had the greatest proportion of workers employed in the six job sectors accounting for the most WFH. Whilst job type is important to propensity to work from home, other factors which might be expected to influence preferences to work from home, such as broadband speed and access to public greenspace, did not explain differences in those WFH or not.
In-person and online grocery shopping
People shopped less often for groceries but spent more
By October the average number of trips to both large supermarkets and smaller food shops was lower than before the spring 2020 lockdown. There were small increases in both types of shopping trips between the spring lockdown and October, although they remained well below pre-lockdown levels. The total number of in-person shopping trips fell from 3.1 before lockdown to 2.2 during lockdown and 2.3 in October. Online shopping frequency increased from 0.22 times per week pre-lockdown to 0.27 during spring 2020 lockdown and increased further to 0.35 by October 2020.
Whilst there has been a net reduction in the combined in-person and online shopping frequency of around 0.6 trips per week, over a half of people said they had increased spending on household groceries compared to less than a fifth who said the opposite.
Increases in on-line grocery shopping were linked to personal health risks and amount of home working
Around a third (32-36%) of the reduction in visits to small food shops or supermarkets were at least partially substituted by online deliveries. Before the pandemic, 17% of households reported receiving home grocery deliveries once a month or more and this increased to 37% of households in October.
The growth in home delivery was greatest among households with people who were shielding and also high among those with other health risks. Twice as many households that were shielding started home deliveries as did those with no health risks (16% vs 8%).
Increases in online shopping are also related to working from home. Before lockdown, there was no discernible pattern between rates of WFH and frequency of supermarket visits. However, from the spring 2020 lockdown onwards, higher levels of WFH were associated with less frequent visits to supermarkets but with more home grocery deliveries, with 45% of the people who started receiving home deliveries during the pandemic also starting to WFH, compared to 33% on average. Changes in online grocery shopping were not related to pre-pandemic income, nor self-reported increases or decreases in income by October 2020.
There was no evidence of a switch to local shops
The proximity of one type of grocery shop was not associated with the increase or reduction of the other type of in-person grocery shop. Whilst it has been suggested that people might be switching to more local shops we see no evidence to support a “switch”. It is clear, though, that longer journeys were more likely to be reduced and smaller food shops had lower reductions in frequency of use than supermarkets.
People had generally good access to food shopping with 89% reporting travelling less than five miles to a supermarket and 98% less than five miles to a smaller food shop before lockdown. Over three quarters (77%) of people live within one mile of the smaller shop they use and 31% within a mile of the supermarket they use. Supermarkets closer than one-mile were visited more often than those further away and this was a consistent pattern over time. However, reductions in visits were greater for those supermarkets that were further away (more than five miles), with people opting to reduce their frequency of visits rather than switching to closer supermarkets instead. The car remained the dominant mode for supermarket trips (just under three quarters of trips). Walking increased from 15% to 19% of supermarket trips, but mostly replacing taxi and public transport ones.
There was considerably more change in the frequency and the modes used for trips to smaller food shops. Around a fifth of those who stopped or reduced trips to supermarkets had either started or increased trips to smaller shops. The average frequency of trips to small shops reduced, particularly for those without a car (-33% for those without a car compared to -6% for those with a car), and the proportion of trips to smaller shops that were more than five miles from home increased. Walking to smaller shops increased for trips of less than five miles, but car use increased for journeys of over five miles. Before the Covid-19 outbreak, smaller shops were visited much more frequently by households without a car, but by October this pattern had reversed.
Mode use across a variety of journey purposes
As seen in the national trends, car and public transport use decreased significantly in the spring 2020 lockdown, but car use recovered more than public transport in the Autumn. Unless otherwise stated mode use reported here is people reporting using that mode three times a week or more.
Walking was the only mode to still be higher than pre-lockdown levels in October, at 154% of pre-lockdown levels. Moreover, we can see that walking had not reached its highest point during the spring lockdown (where it was 114% of pre-lockdown levels) but had continued to increase as the pandemic continued, despite the weather not being as favourable to walking as it was during the Spring.
Changing mode use relates to changing activity patterns during the pandemic
Whilst attention has been on the decrease in public transport use, the dominant factor in mode use appeared to be the reduction in the frequency of visits to different activities. Each activity had a different association with the types of modes typically used for these journeys: for example, rail use was particularly low because there was proportionally a lot of rail-based commuting and business travel. Mode share also varied across areas with some places being more public transport dependent (e.g. Glasgow) or with higher bike commute mode shares (e.g. Bristol). By October bus use as a proportion of pre-pandemic levels was at its lowest at 21% (Ayrshire) and highest at 50% (Lancashire).
Individual concern about Covid-19 risks impacted on mode use but regional differences were not found to be important
There was very little influence of the levels of Covid-19 restrictions experienced in October or cumulatively across the period after the first lockdown, on reported travel behaviour in October. At an individual level however, concern about the health impacts of Covid-19 was significantly related to the reduction in the frequency of use of every mode of transport, with the exception of taxis.
Bus use showed a different pattern. As with other modes, high concern about Covid-19 was related to lower bus use. However, people that increased bus use the most also appeared to have relatively high levels of general concern: 61% of bus users agreed that they had “no choice but to use the bus” and so the data does not reflect choice to the same degree as some other modes.
More people working from home did not result in more sustainable school drop offs
There was a reduction in people who reported walking their children to school from 38% before lockdown to 29% in October. While walking is still undertaken as part of many multi-modal sets of journeys across the week, the general trend appears to have been a greater adoption of the car at least some of the time. Those who used to “drop off [their] children as part of their journey to work, but not at the moment” and who now work from home were, however, more likely to reduce their car only trips to school. This was just over a quarter of those who worked from home full-time in October.
The behavioural adaptations to Covid-19 have been uneven across society
The report details a range of adaptations by specific socio-demographic groups which shows how varied the pandemic behavioural responses have been. Some differences have reduced or disappeared, some have been reinforced and others remain unchanged. Some key points are that:
- Gender differences were exacerbated across the two time points. Women reduced their frequency of use of all modes apart from walking by a greater relative proportion than men, thereby opening up the differentials in car driving and cycling that already existed. Before the pandemic men and women used the train in roughly equal proportions but by October men were twice as likely to be using the train.
- Participants from ethnic minority backgrounds had lower levels of car driving but higher levels of bus and train use before lockdown. This pattern continued into October and became exacerbated with respect to public transport use: people from ethnic minority backgrounds did not reduce their use of buses and trains as much as people from other backgrounds.
- Household income continued to be a factor that strongly differentiated travel behaviour and this differential has been maintained since spring 2020. Income was positively associated with car driving, train use and cycling, but negatively associated with bus use. Walking was undertaken evenly across income groups before lockdown but higher income groups were walking more in October, reflecting greater leisure walking opportunities for this group that also increased how often they worked from home.
Policy implications
How much home working continues is a critical uncertainty?
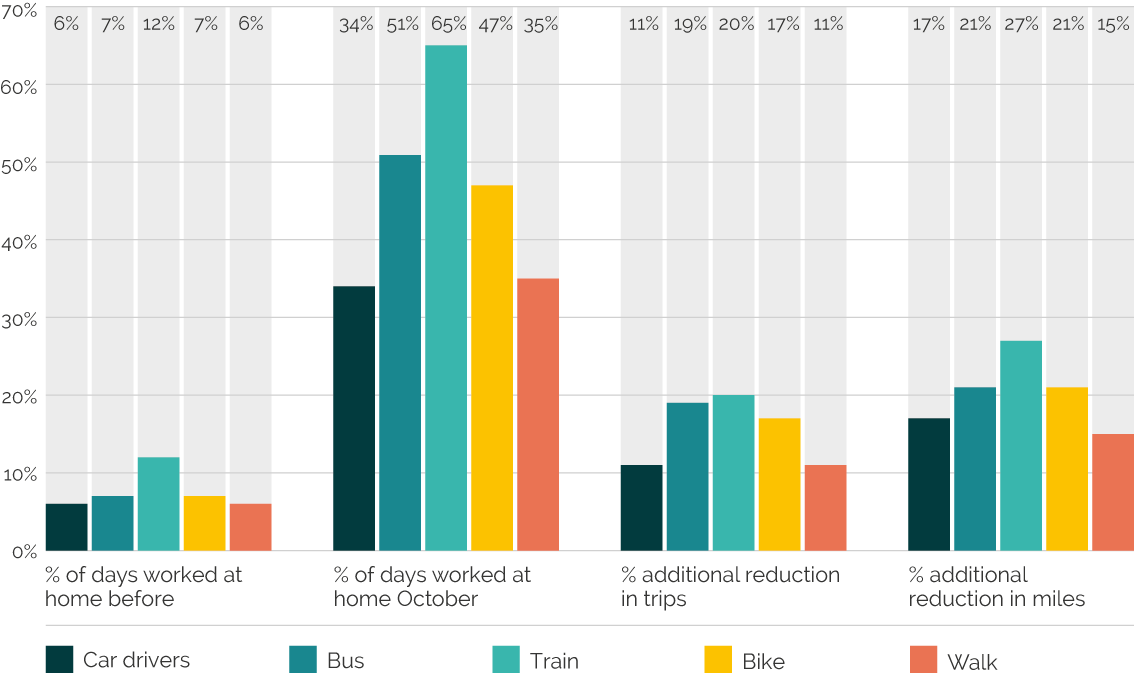
It remains unclear, even in summer 2021, exactly what the return to work patterns for those people currently working from home will be. If those working at home in October 2020 continue to do so for half of their working weeks, then our estimate is that this could reduce miles travelled on the commute by between 15% (for walking) and 27% (for train journeys) in the areas studied compared to pre-pandemic. The reduction in car miles travelled on the commute would be 17%, and cycling and bus use would both see reductions of around 21%. This would have a significant impact on congestion levels, crowding, fare income and the demand for parking. These reductions would potentially improve the quality of the journeys that are made and reductions in traffic could also reduce noise, air quality impacts and climate change emissions.
The benefits of home-working will be impacted by housing relocation decisions
Previously, those who have worked from home have tended to live further from work. Our data suggests that the pandemic has created a new group of people capable of working from home who are living in areas with better access to employment opportunities more locally. They also have access to local facilities and may be able to develop less car dependent lifestyles, if provided with good alternatives such as more walkable neighbourhoods and safer cycling routes. The increase in home working has also contributed to an increase in other home-based servicing activity such as online shopping, as people are more likely to be at home to receive deliveries. The switch to home working impacts on where people spend their time and where economic activity will happen.
Encouraging a shift to more sustainable journeys to school is critical for the autumn
The increase in people working at home has not led to an increase in walking trips accompanying children to school. Some of the school travel patterns that existed pre-pandemic were part of a home-to-work trip chain and may not be as easy to substitute by walking. As work patterns begin to be re-evaluated there are opportunities to re-engage with the travel to school agenda to encourage a mode shift from the car. Our evidence suggests that it cannot be assumed this will just happen anyway despite the general increases in levels of walking.
Different areas are likely to require different levels of public transport transition subsidy
The industrial structure in different areas has resulted in different levels of home working and so monitoring how the return to work differs across places will be important in the coming months. Public transport commuter markets have been impacted in different ways across our survey areas and the recovery trajectory and relative subsidy needs of different places seems likely to vary.
The pandemic has shown parts of the economy to be able to grow with less travel and this could be critical for future climate emission reduction strategies
In transport, it has generally been assumed that an increase in travel is associated with increased economic activity. However, our data on home grocery shopping challenges this assumption. Overall, Kantar estimate spend on groceries for home consumption to have increased by £15.2 billion during the pandemic and, on average, our data indicates that people also spent more at home over this period despite a near 20% reduction in grocery shopping transaction frequency. People have done more whilst travelling less. Longer car journeys to supermarkets have reduced and this could contribute to emissions savings in support of climate change commitments. Reduction in car-based shopping frequency could also enable smaller footprints for parking at supermarkets to be agreed by local authorities. Whilst the shift to online will undoubtedly add to delivery van traffic in residential areas, indications are that online deliveries do not offset reductions in personal miles travelled (Braithwaite 2017).
Publication details
Anable, J. and Marsden, G. 2021. Covid-19 Transport, Travel and Social Adaptation Study: Understanding behaviour change with neighbourhood characteristics. Centre for Research into Energy Demand Solutions. Oxford, UK. ISBN: 978-1-913299-12-5
Banner photo credit: Alireza Attari on Unsplash