
Jillian Anable, Llinos Brown, Iain Docherty and Greg Marsden
Summary
The pandemic has had a major impact on how we all live our lives. As we learn to live with Covid-19 without restrictions on how we travel and where we work, we face difficult questions. Society demonstrated enormous capacity to adapt, including to varying restrictions on travel, and many people were able to reorganise daily life to travel less. Some of this came at great cost, such as the inability to attend funerals or the postponement of weddings. Some changes were, in effect, massive accelerations to trends that were already apparent, such as working and shopping remotely. Almost two years on from the initial lockdown, the economy has recovered to pre-Covid-19 levels, yet across society we are still travelling less than before the pandemic. This report, drawing on a combination of national datasets and insights from a ground-breaking longitudinal survey in 10 areas of the UK, asks what have we learnt, and where do we go next?
The findings are clear and remarkable. We have been able to adapt significant elements of our daily travel to do what we want by travelling less. Whereas previously, most policymakers assumed that the path to economic growth had to mean travelling more, this no longer holds. The headline behavioural insights as we head out of the pandemic are:
- Car traffic is not back to pre-pandemic levels. Weekday car traffic in England stabilised around 10% below pre-pandemic levels throughout summer and autumn 2021 with falls in peak time congestion.
- Working from home, for those who can, has played a critical part in reducing traffic levels. Even if people who have worked from home go back to travelling for half of their working week, there will still be a reduction of 16% in car commute miles.
- Car ownership has fallen. The sale of used – and, in particular, new – cars has fallen below pre-pandemic levels. There has been a significant increase in the number of households reducing from two cars to one. The pandemic did not lead to a ‘dash to the car’.
- Retail spending has been broadly stable but people have visited ‘bricks and mortar’ shops much less often. More intensive shopping and more on-line purchasing have both been a factor in this reduction.
- Many more people have walked more often. The huge increase seen in October 2020 had been maintained well into 2021.
We title our report “Less is more” because these are examples where society has been able to adapt to the changed circumstances without having to rely on more and more mobility to do so. To meet our climate obligations, it is clear that we will need to travel less by car. As we come out of the pandemic, there is a chance to plan differently for transport, to encourage, where possible, fewer trips, a greater blend of virtual activities and more localised and active travel. Less motorised travel can mean more and quicker progress to decarbonisation, and better wellbeing.
However, there are also challenges to be confronted. Public transport has been impacted more than travel by car, in particular the railways since (office) commuters and business travel have been most likely to switch to virtual or hybrid working. Governments have channelled huge amounts of subsidy into public transport during the pandemic to secure services for key workers and to maintain most of the pre-pandemic service coverage. But the message is now coming through loud and clear that the purse strings are being tightened, and it is ‘last orders’ for additional revenue support. It is no exaggeration to say that the coming months are critical for the long-term future of public transport.
None of the positive changes we have identified in travel behaviour to date should be taken for granted. Nor should it be presumed that they will continue to lead to good outcomes if left to chance. The policy choices that are made in the coming months will be crucial in shaping whether we can embed the positive aspects of change and mitigate the negative. We identify six areas for urgent action by the public and private sector:
- Act now to stimulate a return to public transport
- Actively manage the return to the office to kickstart more sustainable commuting
- Prioritise improving pedestrian environments with the funding and attention it deserves
- Encourage leisure cyclists to broaden their cycle use
- Tackle the rise in light goods vehicle traffic
- Support a shift to lower car ownership
Box 1: Eight practical recommendations are made for the public and private sector
Recommendation 1: There needs to be an immediate cross-sector ‘welcome back to public transport’ campaign to win back people who have not used trains and buses during the pandemic.
Recommendation 2: Government adopts a ‘whole economy’ approach to understanding the benefits as well as the costs of public transport subsidy post pandemic as part of its consideration of the future governance, regulation and funding of the sector.
Recommendation 3: The Department for Transport should fund a series of innovation projects as part of its Commute Zero programme to ensure that hybrid working is integrated with sustainable access to work.
Recommendation 4: Local authorities should commit staff to support the development of updated commuter travel plans with employers and work with transport providers to identify the right incentives to smooth demand across the week.
Recommendation 5: There should be renewed focus on delivering significant enhancement of the pedestrian environment, particularly in suburbs and local centres, to support walking as the natural first choice for as many trips as possible.
Recommendation 6: Revenue funding should be committed now to support locally-led campaigns and interventions to encourage people back to more regular cycling and to try new facilities.
Recommendation 7: National governments should conduct major studies to understand the growth in light van traffic and then develop strategies to manage it.
Recommendation 8: Employers, HM Treasury, HMRC and the Department for Transport should work together to create a new set of incentives to replace company car benefits, lock in lower travel and support the shift to decarbonising domestic property.
The short-term actions we identify are important, but they are only one part of the debate about where next. There will inevitably be a desire to ‘put this behind us’ and ‘get back to normal’, but it is essential that we learn from this experience in order to be more resilient to future shocks, including fuel price rises, recession and supply chain disruptions. We really have seen that ‘less is more’ in many circumstances: the accessibility of key services locally, easily reached by foot or on bike, has been essential. The replacement of large elements of commuting by digital connectivity and hybrid working was the foundation stone of adaptive capacity for individuals and businesses. These adjustments initially involved significant costs by all and it is crucial, for both ongoing carbon reduction as well as resilience to future shocks, that they are maintained as part of business as usual in the daily lives of many people.
The recent IPCC report on climate impacts reinforces the inevitability of more extreme climate events both in the UK and overseas. The need for a new national adaptation strategy to face up to these realities has been underlined by the Chief Scientific Advisor to the UK (Vallance, 2022). Whatever the source of the next significant disruption to society, the further we travel and the more frequently we are required to travel, the more exposed we are to risk from such events. The forthcoming UK Climate Adaptation Plan needs to look beyond simply infrastructure adaptation and take seriously the need to plan for societal adaptation. Such a plan should not just be about how to respond in a hurry, but also how to reduce our exposure to risk over time by living differently. If we could switch away from a paradigm where the only view of development is ‘more growth means more traffic’ to one where we do not have to travel so far or so often but can still do the things we want to, then we may have learnt some of the transport resilience lessons from the pandemic.
We should also ask ourselves whether the fetish for long-term investments which deliver comparatively small journey time benefits for commuters and business travellers needs re-evaluating. We have demonstrated that parts of the economy can work quite differently without relying on this. The pandemic has changed labour markets in ways and at a scale and pace which dwarfs transport infrastructure plans. The emotional impacts of restrictions on meeting friends and family and the criticality of – often low-paid – key workers being able to access their workplaces by public transport are just some of the social needs that the pandemic spotlighted but which transport policy has either underestimated, undervalued, or both. It would be surprising, to us at least, if policy makers were not thinking, acting and spending differently after observing everything that has happened over the last two years.
1. What has changed?
The Covid-19 pandemic had a major impact on everyday life across the world. At the start of the pandemic in the UK in March 2020, substantial lockdowns, which were very restrictive on people’s ability to move and take part in activities, were put in place. Over time, as more was understood about the virus and, more recently as vaccination rates across the population rose, those restrictions were relaxed. By early March 2022, England and Northern Ireland had removed all Covid-19 related restrictions, although this was not yet the case in Scotland and Wales. This report looks across the two years that have passed since the first national lockdown and, in Section 1, it explores how, why and how much we travel has changed through the pandemic. In Section 2, it sets out what the opportunities and risks are to future transport policy of the changes observed. It then suggests what should come next so that we lock-in the positive aspects of the changes seen and avoid the worst impacts that might result from a laissez-faire approach.
The report draws on a range of national data sources and a large sample longitudinal panel survey conducted by the research team in 10 parts of the UK (Full details of the study locations and sample sizes can be found in Annex A, and a fuller explanation of the methodology found in Anable and Marsden (2021). The survey was conducted first in summer 2020 and then repeated in late 2020 and summer 2021 (These survey waves correspond to the following measurement periods in the graphs and tables below: Wave 1 conducted June 2020, measuring ‘Before Covid-19’ in February / early March 2020; ‘During lockdown’ in March-May 2020 and June 2020. Wave 2 conducted December 2020, measuring behaviour in October 2020 & December. Wave 3 conducted July/August 2021 measuring June 2021 & July/August 2021) with the same people, providing some unique insights into change over time (Unless otherwise stated, survey data results in this report are Where data in graphs are weighted this has been stated).
1.1 Car traffic has reduced
Road traffic levels varied substantially with the degree of restrictions in place in the economy. The UK Department for Transport (DfT) estimates that during 2021, on average, car traffic levels in England were 85% of their pre-pandemic levels (DfT, 2022). This represents a reduction of 73.2 billion vehicle kilometres. There is a perception however, that things have already gone back to normal and congestion is back to pre-pandemic levels, but this is wrong. Figure 1 shows the change in traffic levels by car during weekdays and weekends over the course of the pandemic. Even in October and November 2021, before Omicron became a variant of concern, weekday car traffic was only averaging 91% of pre-pandemic levels, despite GDP having returned to its pre-pandemic level (OBR, 2021). Weekend travel, by contrast was exceeding pre-pandemic levels across the summer and autumn of 2021, perhaps reflecting some of the ‘catching up’ people were doing. The overall weekend traffic levels were still down on pre-pandemic levels at 88% across the year. Our longitudinal travel data is consistent with this, with regular car use (defined as on three days per week or more) back to 85% of its pre-pandemic level by Summer 2021.
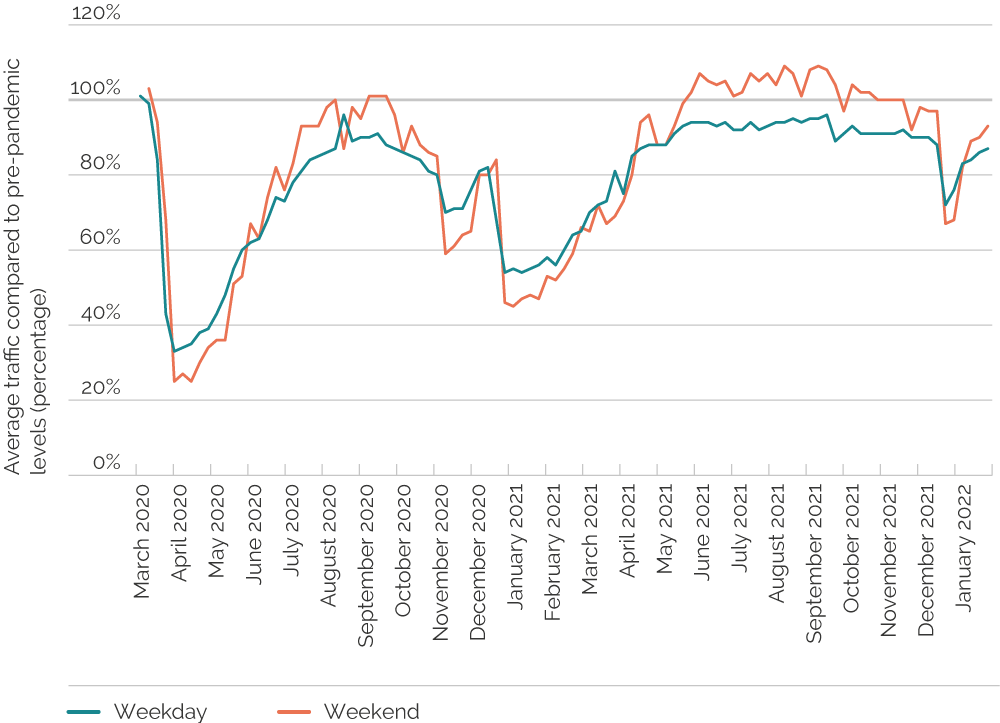
Image description
Line graph shows the peaks and troughs of car traffic levels during the pandemic. The low point for both weekday (33% compared to pre-pandemic levels) and weekend travel (25%) was in April 2020 – the first lockdown. Levels rose once lockdown eased, with another drop in November and December 2020. Since the end of lockdown in March 2021, traffic levels have risen again and are now at round 90% of pre-pandemic levels for weekdays, but are higher than pre-pandemic levels at the weekend – up to 109% in September 2021.
This is quite extraordinary. No-one would have imagined that the economy would be able to bounce back in the way that it has with almost 10% less weekday car travel than before. This is an important signal and an opportunity to change the way we plan to meet the needs of society if we choose to take it.
1.2 Commuting and business travel have changed for many
It has previously been assumed that when planning for economic growth it will be necessary to anticipate more car travel. Certainly, that was the case in the latter half of the last century. However, car travel per head of population has fallen since the turn of the millennium (Marsden et al., 2019). It has fallen most amongst the wealthiest part of the population. As can be seen by the split between weekend and weekday activities in Section 1.1, weekday traffic has not returned to pre-pandemic levels in the way that weekend travel has. This is, in large part, due to the continued prevalence of home working which impacts on both the commute and business travel. Whilst in our survey only 11.6% of worked days were spent working at home pre-Covid, this rose to 41% in June 2021.
Our research shows when people worked from home for some or all of their working hours, they used their car less frequently than those who didn’t work from home (Table 1). We can also see that during the pandemic, those who increased the frequency they worked from home were more likely to reduce their car use than those with no change or a decrease in the amount they worked from home (Figure 2).
| Description | No WFH | Some WFH | 100% WFH |
|---|---|---|---|
| Average days per week on which a car is driven | 2.83 days/wk | 2.47 days/wk | 1.65 days/wk |
| 1 Subsample of those who were working in survey wave 3. | |||
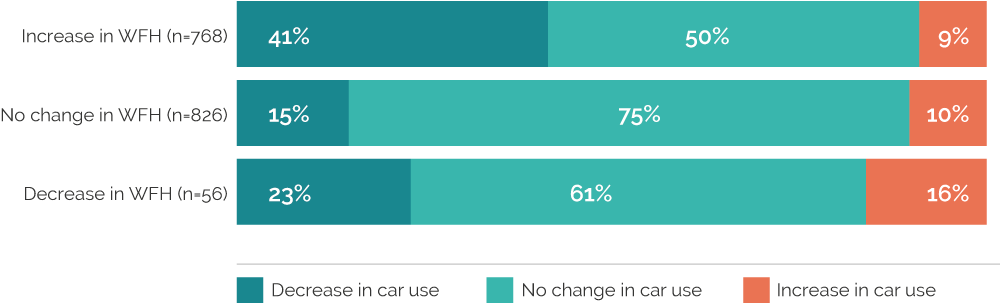
Image description
- Of the 768 people who increased their working from home days between March 2020 and June 2021, 41% decreased their car use, 50% remained the same and 9% increased usage.
- 826 people did not change their working from home days between March 2020 and June 2021 – 15% reported a decrease in car use, 75% remained the same, and 10% increased car use.
- Of the 56 people who decreased working from home days between March 2020 and June 2021, 23% decreased their car use, 61% remained the same and 16% increased car use.
1.3 The reduction in peak hour travel is especially significant
Data from TomTom suggests that in September and October 2021, congestion levels were 6% down on 2019 levels in both the morning and evening peak, with no change during the day (TomTom, 2022). This benefits all road users whether they have had the opportunity to work from home or not. Congestion may feel closer to pre-pandemic levels for some because congestion is concentrated in specific areas, and so it may be the spread or the duration of congestion which is impacted. There have also been increases in light goods and heavy goods vehicle traffic, although not enough to offset the reduction in car travel.
It can be anticipated that more people will commute more often once all of the restrictions around workplaces are lifted and infection levels fall. We have explored how important keeping some level of working from home would be to overall traffic levels. By using data on the number of days worked, the proportion of days worked from home before Covid-19 and again in June 2021, and the main commute mode and distance, we calculated the commuting trips and mileage that would potentially be saved if half the level of working from home that was being undertaken in June 2021 were to be maintained. This seems, to us, to be a plausible outcome or goal.
The outcomes of this analysis are shown in Figure 3 and Table 2 for each mode. A 16% reduction in car commute mileage would be a small but significant impact on total traffic levels as commuting corresponds to around 20% of all car mileage. However, the impacts on the peak period would be much more noticeable. All modes will be impacted by reductions in commute frequency though, not just the car. In Section 2 we look at how to manage the impacts of this on public transport.
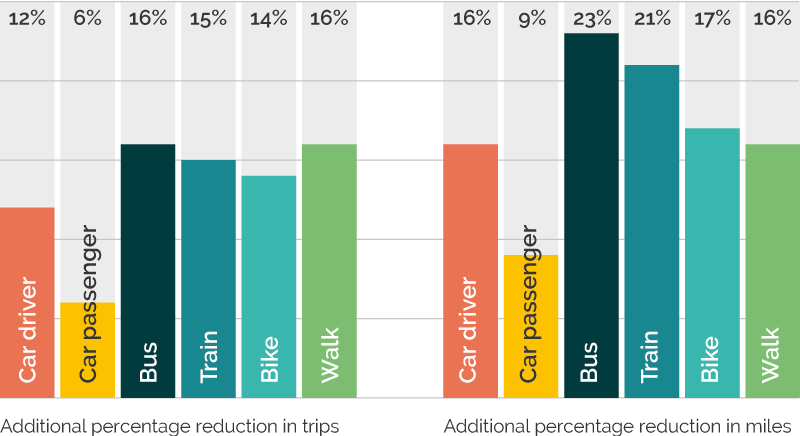
Image description
- Of the 987 households without a car during Wave 1, 8% had bought a car by Wave 3, and 2% had bought more than 1.
- Of the 2,296 households with one car during Wave 1, 4% had no car by Wave 3, and 6% increased to 2+ cars.
- Of the 1,525 households with 2 or more cars in Wave 1, 1% had no car by Wave 3, and 14% had reduced to one car.
| Description | Car driver | Car passenger | Bus | Train | Bike | Walk | Total Sample1 |
|---|---|---|---|---|---|---|---|
| 843 | 60 | 216 | 92 | 71 | 219 | 1724 | |
| Total days worked in one week before Covid2 | 3,886 | 271 | 1,008 | 425 | 343 | 1.026 | 8,016 |
| Total days WFH in one week before Covid-192 | 262 | 35 | 67 | 77 | 26 | 26 | 933 |
| % days WFH before Covid-19 (Feb/early March 2020) | 6.7% | 13.0% | 6.7% | 18.2% | 7.6% | 2.6% | 11.6% |
| Total days worked in one week in June 20212 | 3,827 | 262 | 992 | 412 | 323 | 1.019 | 7,864 |
| Total days WFH in one week in June 20212 | 1,413 | 102 | 442 | 273 | 140 | 387 | 3,252 |
| % days WFH June 2021 | 36.9% | 38.8% | 44.6% | 66.4% | 43.3% | 37.9% | 41.4% |
| % days WFH if 50% of June 2021 level was maintained by each individual | 18% | 19% | 22% | 33% | 22% | 19% | 21% |
| Total days WFH if maintain 50% | 717 | 53 | 225 | 141 | 74 | 195 | 1658 |
| Additional days WFH compared to pre-Covid-19 levels3 | 456 | 17 | 157 | 64 | 48 | 168 | 725 |
| % additional reduction in subset TRIPS4 | 12% | 6% | 16% | 15% | 14% | 16% | 9% |
| Total miles commuted in one week by this subset before5 | 54,761 | 2,323 | 7,157 | 10,969 | 1,456 | 2,813 | 94,777 |
| Total miles saved in one week if maintain 50% WFH5 | 8,798 | 213 | 1,611 | 2,304 | 249 | 438 | 14,555 |
| % additional reduction in subset MILES4 | 16% | 9% | 23% | 21% | 17% | 16% | 15% |
|
|||||||
1.4 Car ownership has reduced
The pandemic impacted more significantly on public transport usage than the car. By late February 2022, bus has only recovered to around 75% of pre-pandemic levels and rail to 66% (DfT, 2022). A critical question then is whether this turn away from public transport has stimulated a turn to the private car? The unequivocal answer to that is no. Data from the Society of Motor Manufacturers and Traders shows used car sales in 2021 were 5% below their 2018 levels and new car sales were 30% down as shown in Figure 4.
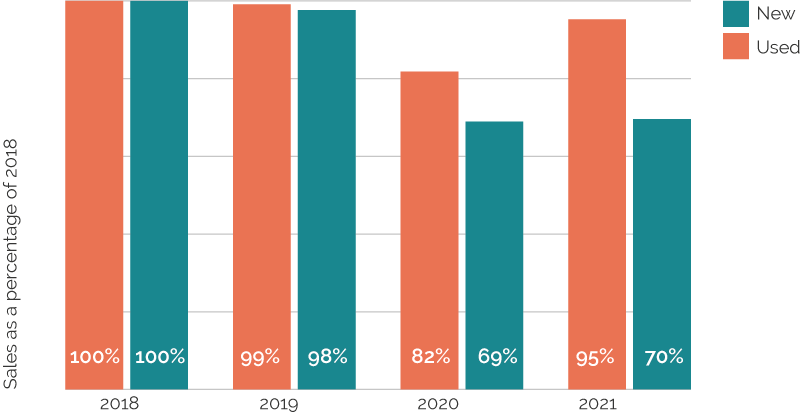
Image description
Car sales have reduced since 2018: in 2020, used car sales were at 82% of 2018 levels, while new car sales were at only 69%. In 2021, used car sales increased to 95% of 2018 levels, but new car sales remained at 70%.
It is likely that the global shortage of microchips which is limiting the supply of new cars is a factor in the reduced demand. However, it is more than this. Our longitudinal survey provides some valuable new insights as to what has been happening to car ownership over time. Figure 5 shows that there is a small overall reduction of cars owned (from 1.18 to 1.16 – a reduction of 1.7%). 8% of households decreased car ownership whilst 7% increased, although the overwhelming majority of households surveyed have not changed how many cars they own. Whilst 10% of households that did not have a car got access to one or more, the biggest shift was 14% of the households with 2 cars before the pandemic reducing to one car. This is important for future policies connected to climate change as reducing car ownership to some degree will form part of a rounded strategy (Brand et al, 2021).
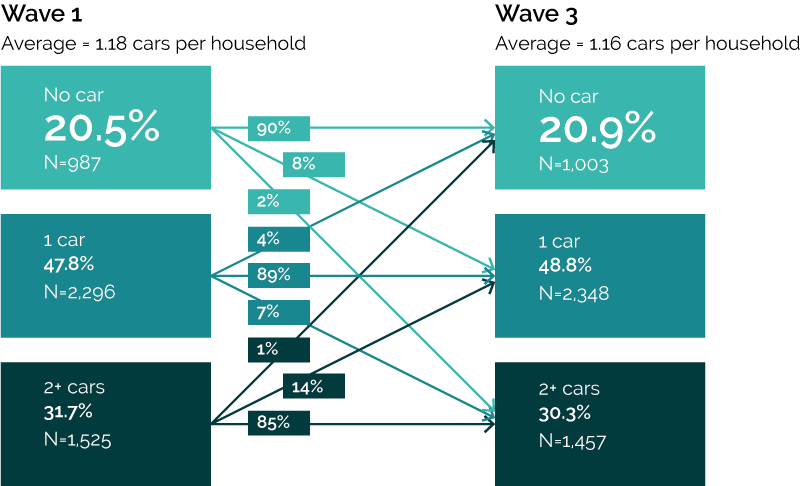
Image description
- Of the 987 households without a car during Wave 1, 8% had bought a car by Wave 3, and 2% had bought more than 1.
- Of the 2,296 households with one car during Wave 1, 4% had no car by Wave 3, and 7% increased to 2+ cars.
- Of the 1,525 households with 2 or more cars in Wave 1, 1% had no car by Wave 3, and 14% had reduced to one car.
Our research explored the extent to which adapting to the pandemic was important to the decision of households increasing or decreasing car ownership. For the majority of respondents in both 2020 and 2021, the pandemic was not a factor in their decisions. However, more households said that Covid-19 was likely to have contributed to the decision to reduce car ownership than to increase it as shown in Figure 6 and this held true over Wave 2 (December 2020) and Wave 3 (July 2021).
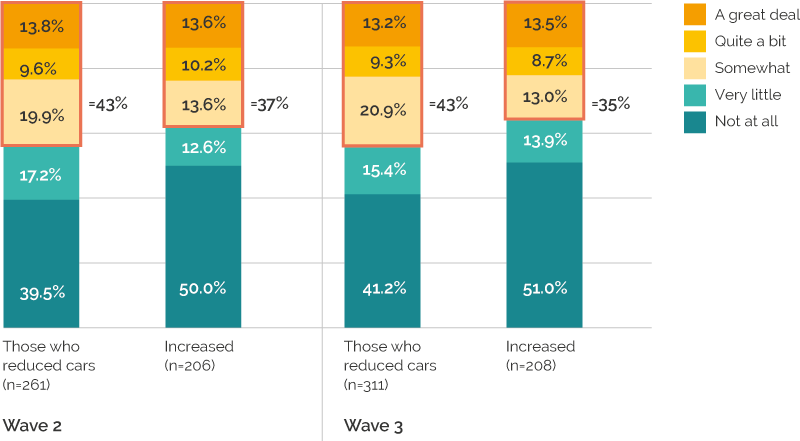
Image description
In Wave 2 of the survey, of those who reduced the number of cars per household (261 households), 43% noted that Covid-19 had contributed to their decision, and for those who increased the number of cars per household (206 households) it was 37%.By Wave 3, of the 311 households that reduced the number of cars, 43% noted that Covid-19 contributed to their decision, and of the 208 households that increased their car ownership, 35% said Covid-19 had been a factor.
Clearly, decisions about car ownership are complex. It seems likely that reductions in ownership are linked to the reduced requirements for commuting in some households. More homeworking amongst multi-worker households may create the opportunities for sharing access to a vehicle for work. Where a car is at home in a single worker household then the potential for other household members to access it is also increased. This too may reduce the need for additional cars. However, there are also motivations for taking on cars which may relate to factors such as companies, particularly earlier in the pandemic, requiring the suspension of car sharing schemes for work due to infection risk and to maintain social bubbles (See guidance at Transport Scotland, 2022b and example at University of Birmingham, 2022). If the supporting conditions which have created an opportunity for some giving up of cars diminish, then it could still be the case that those decisions are reversed. We do not take these changes to be set in stone, but they suggest that reducing car ownership has been an important behavioural response even in the absence of policies to encourage it. Less is more, at least for some households, and this was not expected.
1.5 More walking
More people have walked more often and this has stuck throughout the pandemic. Our longitudinal data shows that 58% of people were walking three days a week or more in summer 2021 compared with 36% just before the pandemic as shown in Figure 7. When we look at these figures as a proportion of the same measure pre-Covid-19, walking in June 2021 was 159% of pre-pandemic levels (Figure 8). Walking is the only mode of travel which has seen an increase in the number of people undertaking it regularly.
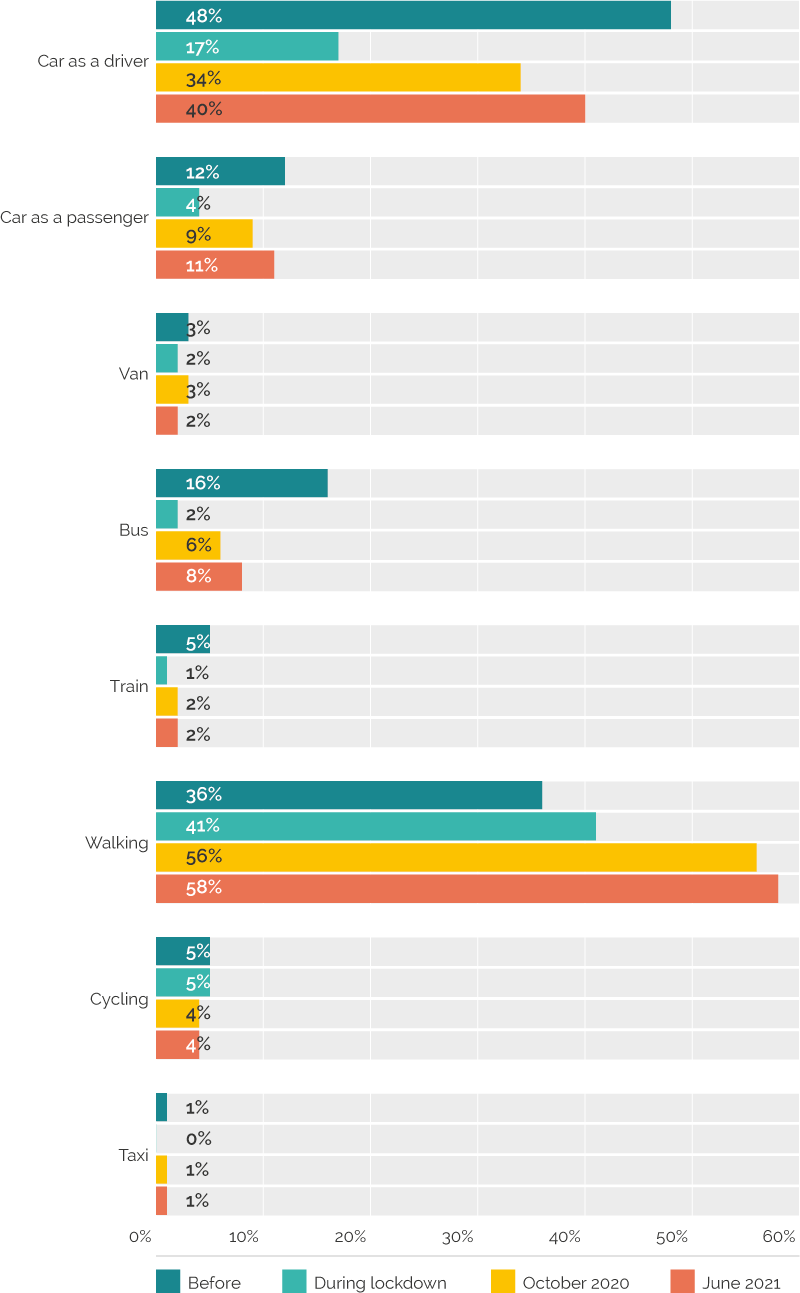
Image description
- Walking is the only transport mode that has increased in use compared with pre-pandemic figures. Before Covid-19, 36% of respondents reported walking on at least three days per week. This increased to 41% during the first lockdown, 56% in October 2020 and 58% in June 2021.
- The number of respondents who drove a car on at least three days per week reduced from 48% pre-pandemic to 15% during lockdown, but rebounded to 40% in June 2021.
- Other notable changes are in bus use, which began at 16% of respondents, fell to 2% during lockdown and was only 8% in June 2021. Train use was also less than half of pre-pandemic levels (5% of respondents) by June 2021 (2% of respondents).
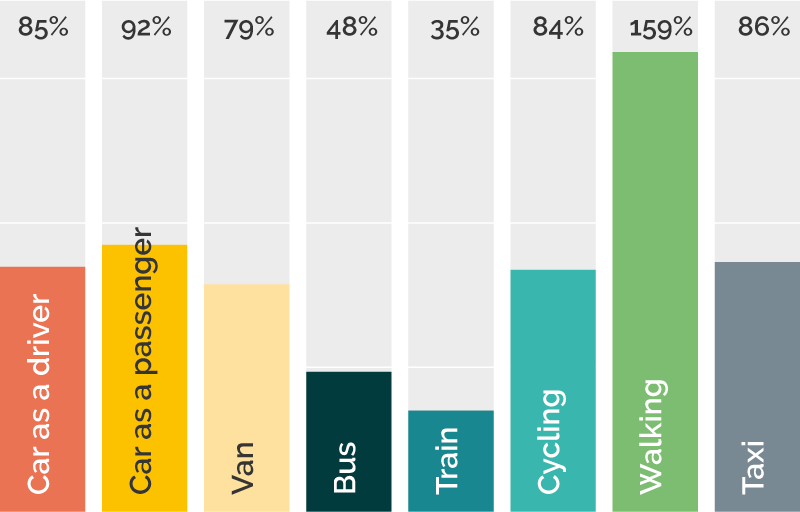
Image description
Transport mode use at least three times per week in June 2021, compared to pre-pandemic levels: car as a driver 85%; car as a passenger 92%; van 79%; bus 48%; train 35%; cycling 84%; walking 159%; taxi 85%.
It is important to note that this is not just people walking for leisure. At the start of the pandemic in 2020, walking was one of the sources of daily exercise people were allowed to undertake. It appears that people enjoyed this and have built it into more parts of their everyday life. Figure 9 below shows the proportions of journeys that involve walking. Whilst this dropped a little from the autumn of 2020 to summer 2021, it was still twice the pre-pandemic level. Figure 10 shows that people are walking for all sorts of activities. Whilst walking for leisure has been important and is the most popular purpose, walking for visiting friends, grocery shopping and to access work taken together are more frequent than leisure. Less motorised travel has been accompanied by more walking. We need to take a rounded view of the impacts of the pandemic on travel.
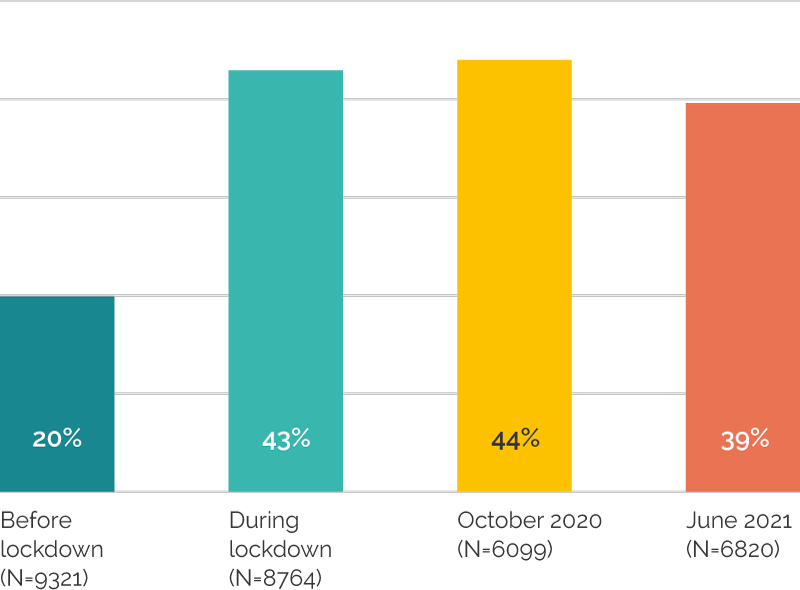
Image description
Average proportion of journeys which involved walking before lockdown was 20% (9,321 respondents). During lockdown that increased to 42% (8,759 respondents), and increased again to 44% (6,099 respondents) in October 2020. By June 2021, an average of 40% of journeys involved walking (6,809 respondents).
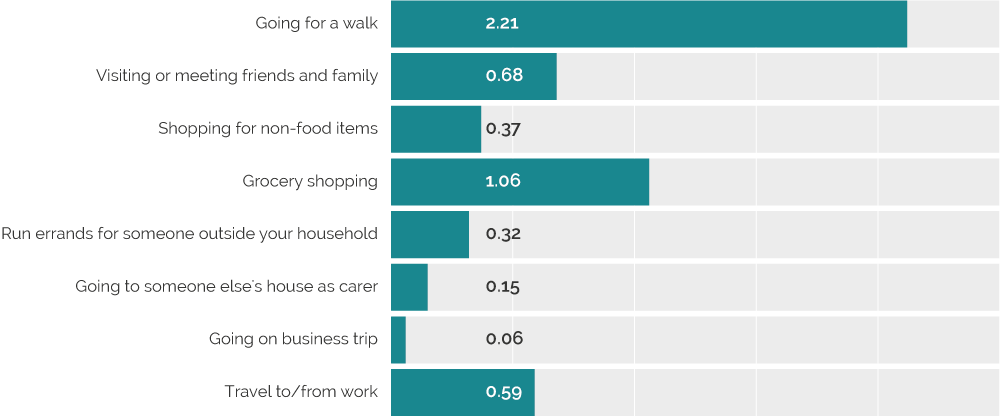
Image description
The purpose for walking in June 2021 was noted as mostly for going for a walk – an average of 2.21 days per week, while grocery shopping was noted as the purpose for 1.06 days per week. Travelling to and from work was the purpose for, on average, 0.59 days per week, with visiting friends and family was the purpose for 0.68 days per week.
Why has this story not been highlighted? The simple fact is that walking is taken for granted and neglected in our data collection processes. It has not, for example, been possible to report walking statistics on the Department for Transport’s daily Covid-19 statistics. In Scotland, walking was reported on, but the method depended on count sites located largely in city centres, placed there to count footfall for economic purposes. These were the places which had the largest reductions in travel demand and so it is not surprising that the statistics reported a fall in walking. The September 2021 statistical release from the English National Travel Survey reported that, in 2020, walks of at least a 20 minute duration three times a week were up in every age group except 17 to 20 year olds (DfT, 2022b). The average increase across groups was around 7%. More comprehensive data on walking, which can be reported on more rapidly, is a key evidence gap highlighted by the pandemic.
Walking has huge health benefits (Kalmeiher et al, 2017). Less travelling by motorised transport has meant more time walking. If one consequence of the pandemic is that more people are walking more, that is a major prize to hold on to. Much of this walking has been in neighbourhoods and away from our major centres, in the places which do not routinely monitor footfall and do not necessarily attract funding for pedestrian improvements. We cannot assume that the numbers will remain high without putting in place policies to support this.
1.6 On-line retail continues to boom
People could not physically access most goods and services as easily during lockdowns. This fuelled an increase in on-line shopping for goods. It also triggered innovations in service provision with more businesses offering web-centric offerings. In turn, the supply chain adapted to enable it to provide services to a much bigger on-line market. Our research found that, as more people have been at home more of the time, the convenience of home delivery has further increased (Anable and Marsden, 2021).
The shift to on-line is not a new trend. Prior to the pandemic, on-line retail was growing consistently at around 1.3% per annum (Figure 11). The last quarter of 2021 showed that on-line had jumped to 28.3% of all retail sales. This is 6.7%-points higher than it would have been had growth followed the pre-pandemic trend, around one-third more. This is a major acceleration in the shift to on-line. It is also somewhat down from the peak quarter in early 2021, where 35.6% of all sales were on-line, which suggests that the proportion of on-line sales at the end of 2021 is by no means a ceiling.
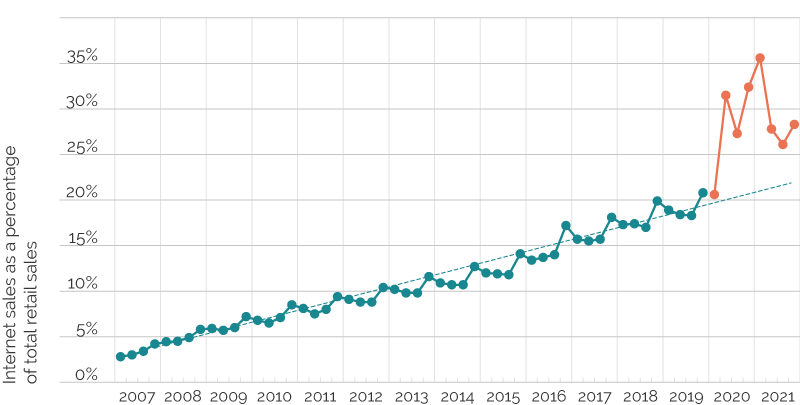
Image description
On-line retail sales showed steady growth from 2007 (2.8% of all retail sales in Q1 2007) to 2019 (20.8% of all retail sales in Q4 2019). On-line sales since the beginning of the pandemic fluctuated from 20.6% in Q1 in 2020, reaching a peak of 35.6% in Q1 2021 (winter lockdown) and dropping to 28.3% in Q4 in 2021 – 7.5% higher than pre-pandemic.
Whilst consumers still value the face-to-face shopping experience, the pandemic has meant many more people have experienced on-line shopping and therefore will be more likely to continue to use it for some transactions. Whilst sales may drop off somewhat as the risk of infection falls, this trend has accelerated what was happening already and this seems unlikely to fall back to anything like pre-pandemic levels. On-line sales in the food sector have doubled with weekly sales in October 2021 being £377m compared with £177m in October 2019 (ONS, 2022b). This looks like a one-off big jump which has been retained.
An important change which has accompanied a shift to greater on-line shopping has been a reduction in the frequency of shopping. Our data on food shopping shows very limited mode shift for the journeys which continue to be made, but a significant reduction in the frequency with which shops are visited (Figure 12). Whilst it has been suggested that people might be switching to more local shops, we see no evidence to support a “switch”. It is clear, though, that longer journeys were more likely to be reduced and smaller food shops had lower reductions in frequency of use than supermarkets, hence the reduction in distance travelled was greater than the reduction in journeys.
As the pandemic has progressed, fewer people were staying away from food shops altogether but there was still a reduction in trips to food shops of 24% in summer 2021 when most restrictions were lifted (Table 3). Those people who receive home grocery deliveries make fewer trips to both supermarkets and local food stores than those who do not.
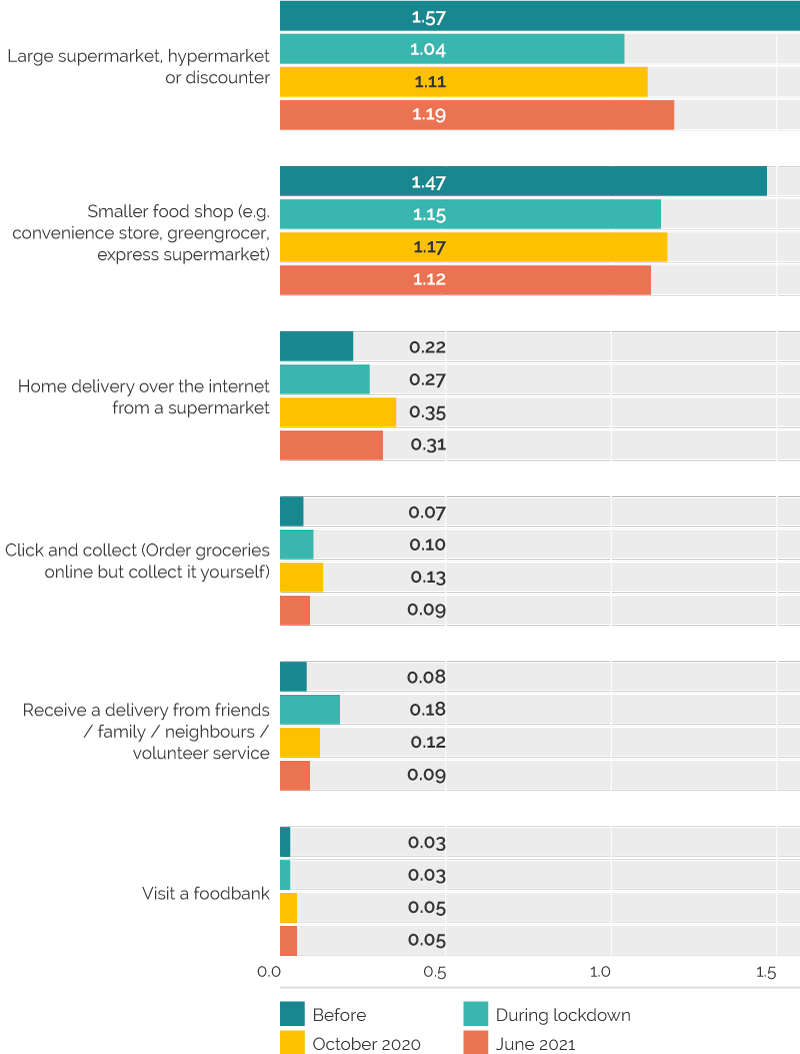
Image description
- Survey results show that shopping at large supermarkets, hypermarkets or discount stores has not returned to pre-pandemic levels – on average, respondents shopped on 1.57 days per week pre-March 2020, and only 1.19 days per week in June 2021.
- Shopping at smaller food stores has also decreased in frequency, from 1.47 days per week pre-March 2020 to 1.12 days per week in June 2021.
- Home delivery from a supermarket shows a slightly higher average, from 0.22 days pre-March 2020 to 0.31 days in June 2021.
| Indicator | Time period | Supermarket | Smaller shops | Online |
|---|---|---|---|---|
| Percentage never visiting a supermarket or smaller shop | Before lockdown | 2% | 4% | 56.6% |
| During lockdown | 17% | 17% | 63.7% | |
| October 2020 | 17% | 19% | 62.9% | |
| June 2021 | 12% | 14% | 58.5% | |
| At least once a week | Before lockdown | 70% | 58% | 6.3% |
| During lockdown | 52% | 49% | 9.9% | |
| October 2020 | 51% | 49% | 12.5% | |
| June 2021 | 55% | 46% | 11.8% | |
| Change in days per week visited or obtaining a delivery | Before lockdown to June 2021 | –24% 1.6 to 1.2 days/week |
–24% 1.5 to 1.1 days/week |
+41% 0.22 to 0.35 days/week |
| 1 Weighted. Before lockdown and during lockdown N=9362, October 2020 N=6209, June 2021 N=6878. | ||||
When we examine who has been shopping in-person less often, our data shows that people who work from home for some or all their working week receive home deliveries more frequently and visit supermarkets less frequently than those who do not work from home (Figure 13). These differences were statistically significant in October 2020 and June 2021.
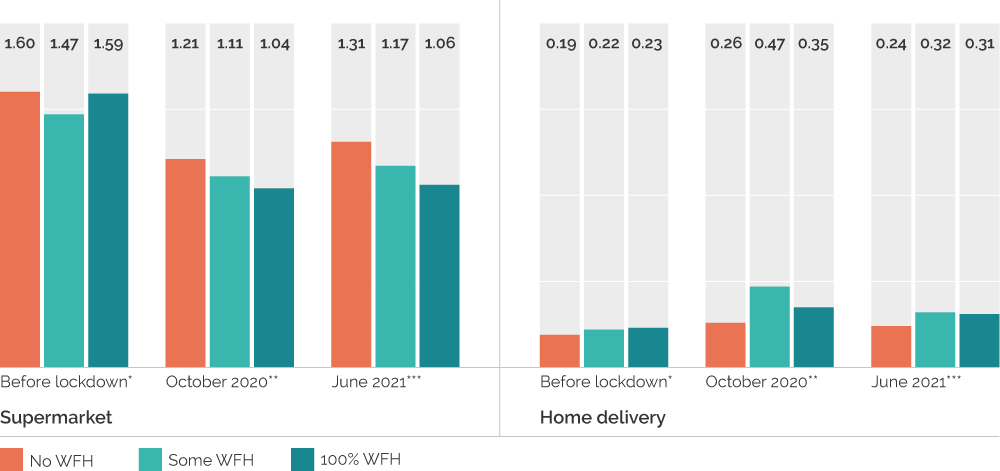
Image description
People who did not work from home before lockdown in 2020 were most likely to visit a supermarket (1.6 days per week), and continued to shop most often in a supermarket. Those who worked from home some of the time pre-pandemic were least likely to shop in a supermarket (1.47 days), but those who worked from home 100% were least likely to shop in a supermarket in October 2020 (1.04 days) and June 2021 (1.06 days).
Those who did not work from home were the least likely to use home delivery grocery services throughout the pandemic (0.19 days before March 2020, 0.24 days in June 2021). Very similar numbers of people who worked from home some of the time and 100% of the time before March 2020 and in June 2021 tool home deliveries of groceries, while in October 2020 more people who worked from home some of the time received home deliveries for groceries.
To really understand whether shopping a bit less frequently can be a part of a future strategy, a range of factors need to be considered. First, to what extent is the reduction in private miles offset by increased delivery van miles, and how is that managed? Second, how is the time not spent shopping used? If it is used on other journeys of a similar or longer length by car, then there is simply a redistribution of travel, although our data does not seem to support this. Therefore, although there is an opportunity for less frequent shopping to bring environmental benefits from less car-centric activity, it is not a given. Without intervention, it could make things worse.
1.7 Public transport use has fallen
The decline in public transport use has been well documented (see Figure 14). The key questions relate to why it has not recovered to the same degree as the private car to date and the prospects of it bouncing back in the coming months. The latter question is strongly contingent on the actions which governments take in the coming weeks and months of the transition out of pandemic restrictions.
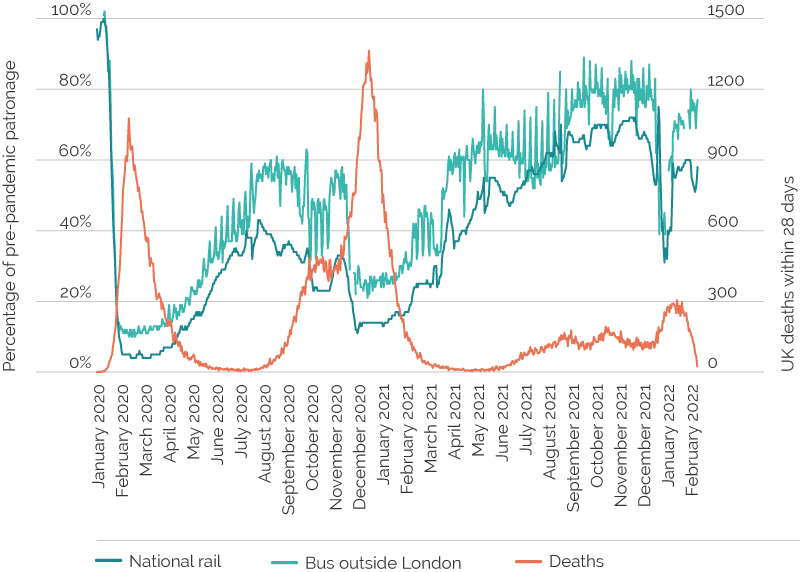
Image description
Use of national rail and bus services outside London have suffered during the pandemic. At the lowest point in March 2020, national rail services were only at 4% of pre-pandemic use, with buses faring slightly better at 10%. Passenger numbers gradually increased as restrictions lessened, but bus use was at 80% of pre-pandemic levels at the end of January 2022, with rail use at 60%.
In November 2021 rail was averaging 71% of pre-pandemic weekday patronage and bus use 81%, the highest of the pre-pandemic levels seen. These averages hide areas where the return was stronger but also those where the return was weaker. One of the reasons for the slow recovery in public transport use is the different commuting behaviours identified in Table 2 earlier, where bus and rail commuters were still working from home more days a week in summer 2021.
Table 4 compares different socio-demographic groups according to the degree to which they changed their bus and train use since before the pandemic. For both bus and train travel, reductions were greatest among females, older people, most highly educated, the higher social grades and those with children and cars. Even though the reductions in train travel are, on average, greater than for the bus, they have actually been concentrated among a narrower subset of passengers, particularly females and both those with the lowest or highest education. This suggests that any campaign to attract people back on to public transport, as well as growing the market beyond what it was pre-pandemic, has a lot of scope to target specific segments of the population.
| % Difference before Covid-19 to June 20211 | |||
|---|---|---|---|
| Description | Bus | Train | |
| Gender | Male | -44% | -50% |
| Female | -47% | -57% | |
| Age group | 18–24 | -27% | -27% |
| 25–44 | -48% | -54% | |
| 45–54 | -40% | -58% | |
| 55–69 | -45% | -58% | |
| 70+ | -55% | -62% | |
| Education | No qualifications | -30% | -57% |
| School to aged 16 | -34% | -36% | |
| A-level, degree, professional | -56% | -59% | |
| Postgraduate and PhD | -52% | -65% | |
| NRS social grade | ABC1 | -53% | -59% |
| CD2E | -37% | -45% | |
| Ethnicity | White | -48% | -56% |
| Ethnic minority | -23% | -39% | |
| Children in household | Children at home | -45% | -55% |
| No children at home | -45% | -53% | |
| Access to car in the household | Cars in household | -53% | -58% |
| No cars in household | -38% | -45% | |
| 1 Sample size N=6878 (wave 3 survey) apart from education which is N=4569 (people who answered wave 1 and wave 3). Weighted. | |||
Public health messaging around social distancing has sometimes been simplified to “avoid public transport”. Whilst this was to enable social distancing to be preserved for essential users, it is possible that this will have put people off from public transport if it has damaged perceptions of safety. Transport Focus has conducted regular surveys of users and non-users of public transport throughout the pandemic. The findings are important. Users of bus and rail have had remarkably high reported feelings of safety which are only slightly impacted by periods with very high infection rates (shown in Figure 15 where shaded lines correspond to periods with high infection levels). By contrast, non-users are twenty to thirty percent less likely to report feeling safe about using public transport. This is true also of people who used to use public transport but who had not returned to doing so. Former rail users report feeling 20% less safe than current rail users (Transport Focus Data Hub – Covid-19 Travel Survey – statistics own elaboration based on data periods shown in chart. Transport Focus, 2022). In order to grow public transport use it is going to be critical to encourage former users to come back.
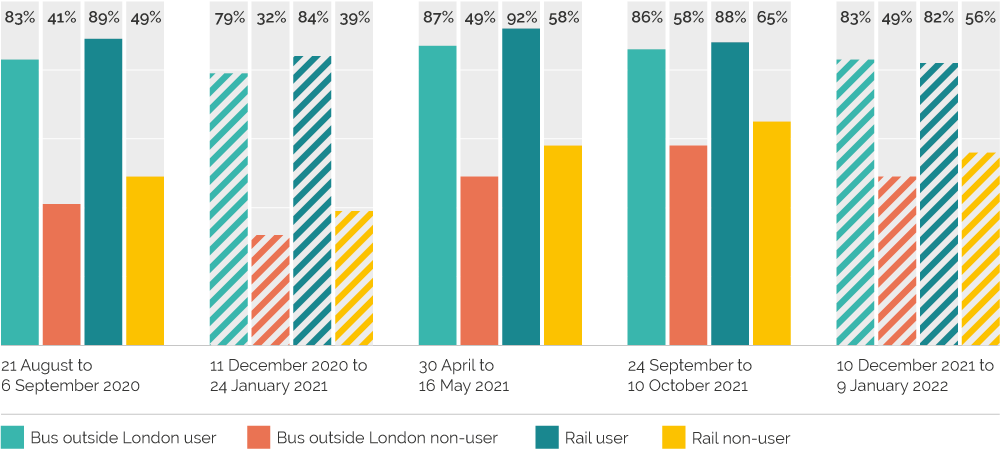
Image description
Graph shows that both bus users outside London and rail users felt safer using buses and trains than those who did not use rail or bus services. Between 21 August and 6 September 2020, 83% of bus and 89% of rail users reported feeling safe travelling by bus or train, while 41% of non-bus-users and 49% of non-train users reported feeling safe.
Between 24 September 10 October 2021, feelings of safety for bus and rail users had changed little (86% for buses, 88% for trains) while non-users felt safer – 58% of non-bus users, 65% of non-train users.
There is likely to be less commuting and much more variable patterns of commuting, all of which needs pro-actively managing. The pre-pandemic position for public transport was not perfect. It can be expensive to provide additional public transport services which are only full for one or two journeys a day to cope with a large peak. It is also the case that public transport was overcrowded during the peak hours in major centres before the pandemic. Squeezing in additional rail services was causing reliability problems in some areas. However, lower public transport use can also bring about bad outcomes where service withdrawals make the service less attractive to the remaining users, who then look for other options.
Our work in Table 2 suggests that if people who have been homeworking continue to do so at 50% of the levels of June 2021 then this will reduce commute train trips by 15% and bus trips by 16%.
Huge amounts of public funding have been committed to supporting services during the pandemic. This provides a platform to re-build from. Less public transport is a risk to a range of policy goals such as carbon reduction, congestion management and social inclusion. We consider where next for public transport in Section 2.
1.8 Trends in cycling are unclear
The evidence on the impacts of the pandemic on cycling are unclear. At the start of the pandemic there was a huge surge in cycling with the peak being reported to be 323% of its pre-pandemic benchmark in England in late May 2020 (DfT, 2022). Roads were empty of cars, the weather was excellent and cycling could be undertaken as part of the daily allowance for exercise.
Over time, the surge in cycling has diminished. It is difficult to be clear about the exact performance over time as the Department for Transport’s data is relative to a comparable day in March before the pandemic. Cycling levels vary across the seasons and so comparing Autumn and Winter with Spring and Summer is unreliable. Comparing March and April 2021 to pre pandemic, the national data shows an overall increase of 5%, although it is slightly lower than pre-pandemic during the week and higher at weekends, mirroring the pattern in cars. Our data (Figure 7) suggests that cycling three days a week or more fell slightly from 5% to 4%.
Our data showed that working from home was undertaken by a greater proportion of cycle commuters than those going to work by car or walking (Table 2). As more journeys are made to workplaces from the Spring of 2022 it will become clearer the extent to which people who used to commute by bike return to doing so. The value of the pop-up infrastructure and the permanent and higher quality schemes that have followed behind will also become more apparent. Rather than waiting to see what the impact of the pandemic might have been on cycling, there are opportunities to promote the bike which we consider in Section 2.
1.9 A mixed picture on residential relocation
Prior to the pandemic there was a very slow increase in the amount of home working which people undertook. Where people worked from home more this has been associated with residential relocation to further from the main place of work. To some extent, distance and frequency of travel have been traded off (Hook et al, 2020).
Our work showed that during the pandemic, those people who were working from home more lived in areas with good accessibility to local facilities and employment, opposite to previous expectations (Anable and Marsden, 2021). Over time, of course, people might relocate.
The national data on migration within the UK lags by around a year and so the best that can be done is to infer housing mobility by sales and rental prices. ONS data on housing sales suggests that the market as a whole was down 8.9% in 2020/21 compared to the average across 2017 to 2019 (ONS, 2022c).
Reductions were lowest in ‘mainly rural’ areas and highest in ‘urban with town and city’ but the picture is quite mixed with ‘largely rural’ areas showing no differences to more urban categories. Altogether, our data suggests a net reduction in travel from increased working from home, Preferences for more connected and accessible areas may mean that any residential relocation that does happen can still result in lower travel overall.
market statistics have shown a reduction in rental prices in London and rises elsewhere in the country (ONS, 2022d), although the London market appears now to be recovering (Figure 16). This may reflect relocations away from London when offices were closed, but it may also represent movements from London to other cities as organisations themselves have responded to the new working realities the pandemic has generated. A movement from city to city is quite different to a shift from urban to rural living. As yet, it appears that the fears of the flight from the city appear unfounded (Pidd, 2022), but this requires further assessment over time.
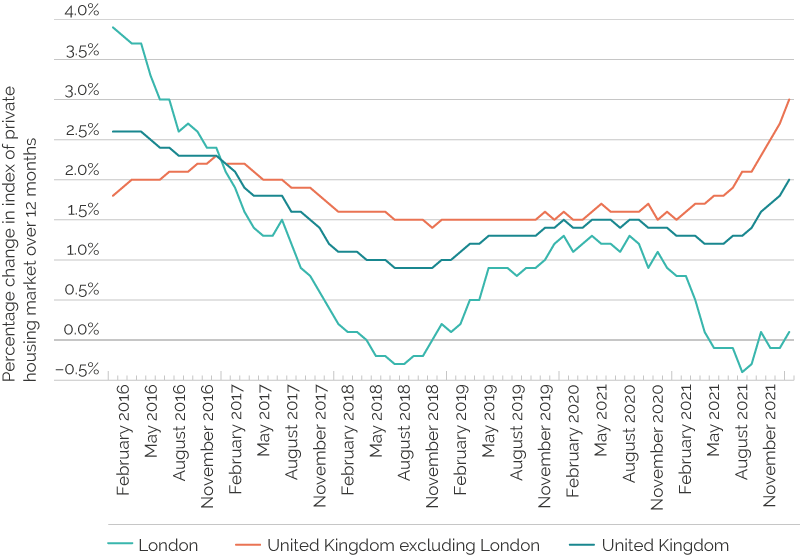
Image description
Line graph shows the percentage change in index of private housing market over 12 months had decreased between 2016 and 2018, with a low point for London of -0.3% in August 2018, and 1.4% in the rest of the UK in November 2018. The index rose and levelled in late 2019 and early 2020 (1.1% in London, 1.5% in the rest of the UK), with a marked increase in the index for the rest of the UK to 3% in January 2022. Meanwhile, the London index fell to a low of -0.4% in August 2021, rising to 0.1% in January 2022.
2. Policy recommendations
Although the threat of new variants remains, the policy system is now clearly planning for a post-pandemic scenario in which transport behaviour and provision adapts to Covid-19 becoming another endemic disease. We see two principal time horizons over which policy choices will play out; those urgent actions that will frame the parameters of the recovery from the pandemic over the next 12-24 months, and longer term issues reflecting the impact of the pandemic on trends and shifts measured in years or decades that will play a key role in shaping the pathways towards net-zero.
2.1 Urgent policy actions
In our previous reports, we have highlighted that nobody currently working in the transport sector has experienced a set of events that have changed behaviour and service provision as profoundly as the Covid-19 pandemic has done (Marsden et al. 2021; Marsden and Docherty 2021). Two years on, despite the obvious desire to ‘move on’ to find some kind of ‘new normal’, there are elements of the mobility system that have changed more profoundly and rapidly than at any other point in the modern era. As Section 1 demonstrates, these shifts are both positive and negative, but their scale means that the challenge for policy to accentuate the positive and mitigate the negative is immense. Here, we identify six areas for urgent action and, across these, eight recommendations.
Action 1: Act now to stimulate a return to public transport
Steep reductions in passenger numbers during the pandemic triggered unprecedented government financial support to keep public transport services running. Reviewing the impacts of the pandemic on the finances of the railway, the Office for Rail and Road noted that government funding for the railway increased by a staggering £10.4 billion in 2020–21, reaching a total of £16.9 billion. Around £2bn of funding support has been provided to the bus industry in England alone. This has enabled essential services to continue to be run and, whilst there cannot be a blank cheque, the value for money obtained from sustaining these services through the pandemic could be massively undermined if the transition post pandemic is not managed carefully.
The spending on rail is a massive uplift and the Treasury has already begun to demand significant cost reductions – around 15% per annum – from Train Operating Companies. Reduced timetables are already being run. On 1 March, £150m was announced to support the bus network in its transition to post-pandemic conditions but this is the “final tranche” of such support (DfT, 2022c). It is unclear if this is new money or will be taken from the £3bn promised for growing bus services in Bus Back Better. In London, political tension between Westminster and City Hall has manifested itself in extremely short – in some cases a few days long – funding horizons and Transport for London consulting on service rationalisation on the order of 20% on bus and 10% on underground to save around £2bn annually (BBC, 2021).
Without the additional funding provided by the Treasury it is clear that there would be even larger and more immediate cuts to services. The Urban Transport Group estimated that around 30% (or 300 million passenger journeys) could have been lost from the bus network without the additional support (Urban Transport Group, 2022). It is well understood that it is harder to win passengers back than it is to keep them and six months is not long to deliver this, or to understand what could be achievable. As Section 1 shows, the coming six months will be critical in encouraging people back to public transport for at least some of the journeys they used to make. New markets will also need to be made. Whilst peak hour car traffic remains supressed there is also an opportunity to introduce bus lanes to improve service performance and reduce operating costs.
Recommendation 1: There needs to be an immediate cross-sector ‘welcome back to public transport’ campaign to win back people who have not used trains and buses during the pandemic.
Our data suggests that there may well be a structural shift away from commuting and business travel in the market for public transport, and in particular rail, and this will demand innovation and adaptation from the sector to respond. But there are risks to cutting service levels on both bus and rail too quickly. Reducing effective public transport provision would further entrench social inequality in direct contradiction to the ‘mission’ for improved services articulated in the Levelling Up White Paper (DLUHC, 2022), particularly in terms of making access to employment more difficult (Chatterjee et al, 2019).
What did we learn about the social value of public transport during the pandemic? It was a vital lifeline for key sector workers that underpinned the continued working of the economy. As well as re-evaluating the costs of providing public transport there is a need to re-examine the wider benefits of that provision. A strong public transport network was invaluable in the response to this pandemic in ways which were not well anticipated. In deciding when and how to turn off the taps to pandemic related recovery funding there is an equal need to reassess the purpose and quantum of on-going support.
Recommendation 2: Government adopts a ‘whole economy’ approach to understanding the benefits as well as the costs of public transport subsidy post pandemic as part of its consideration of the future governance, regulation and funding of the sector.
Action 2: Actively manage the return to the office to kickstart more sustainable commuting
As working from home guidance is removed, people will begin to search for the best blend of working between home and office. How this will play out will depend not just on personal preferences, but also on the attitudes of employers and the levels and cost of public transport provision on offer as noted above. Throughout the pandemic, there has been a reasonably active public debate about the impact that working from home has had on economic performance and individual wellbeing. Two years in, it seems that many of the fears about a loss of productivity have not come to fruition (Zimmermann, 2021), and that many employees regard the wellbeing benefits of working from home some or all of the time to be considerable.
Given the length of time over which people have become accustomed to new behaviours, it seems highly unlikely that commuting to major cities will simply ‘rebound’ over any kind of realistic planning horizon. Indeed, the reduction in the average numbers of days worked in the office is a good example of a long-established trend that was massively accelerated by Covid-19. The question to be addressed is how the rebalancing between pandemic levels of home working and a post-pandemic position will unfold.
The key risk facing the transport system is that a majority of white-collar firms will agree a similar new bargain with their staff that is based around a shorter ‘office week’ of say Tuesday – Thursday, thus in effect recreating the peak but with only 3 days’ ticket revenue to fund the infrastructure and services to sustain it. This would do little to repair the financial position of the sector as noted above. Even worse, if public transport fares are uncompetitive for occasional travel then there are risks that former season ticket public transport users could convert to being occasional car commuters. There is a need to pro-actively manage future hybrid working to ensure that this works for firms, individuals and the transport sector (Transport Scotland, 2022). This should also address the whole system energy impacts of different space heating needs between home and work. It should consider the role of flexible working patterns and timings in workplace equality.
Recommendation 3: The Department for Transport should fund a series of innovation projects as part of its Commute Zero programme to ensure that hybrid working is integrated with sustainable access to work.
Recommendation 4: Local authorities should commit staff to support the development of updated commuter travel plans with employers and work with transport providers to identify the right incentives to smooth demand across the week.
Action 3: Prioritise improving pedestrian environments with the funding and attention it deserves
Perhaps the most striking difference between our data and that issued by governments during the pandemic concerns walking. People have walked more. Much more. Less travelling by other modes seems to have opened up new opportunities for walking which people have stuck with. Retail spending figures, which show local neighbourhoods doing much better than city centres (Cook, 2022), also tally with our self-reported data on walking being the mode of choice for many more local trips. This story has been hidden by a lack of good quality data on walking as set out in Section 1. There is a goal in England for 50 per cent of short trips to be cycled or walked by 2030 (DfT, 2020). Walking will provide most of this and the pandemic suggests that increasing walking has been more of an option for more people than cycling.
Walking has been called the ‘Cinderella mode’ of transport planning (Whitelegg, 2016), and is often much less visible in the debate about increasing active travel than cycling. Yet walking is at the heart of ideas about 15 or 20 minute neighbourhoods. Most walking trips are on roadside pavements in urban areas (Paths for All, 2019) and yet these are often overlooked for investment. Encouraging people who are working at home for some or all of the week in future to walk to local shops and facilities will be an important part of keeping car use down and that means improving conditions across a wide range of neighbourhoods. There is compelling evidence of the huge positive impact on public health that more walking brings (Lee and Buchner, 2008). It is essential, therefore, that active travel schemes maximise the potential increases in walking, and that local pedestrian improvements do not get crowded out when cycling schemes are implemented.
Recommendation 5: There should be renewed focus on delivering significant enhancement of the pedestrian environment, particularly in suburbs and local centres, to support walking as the natural first choice for as many trips as possible.
Action 4: Encourage leisure cyclists to broaden their cycle use
The vastly increased numbers of people cycling early in the pandemic were argued by some as evidence that there was massive, suppressed demand for cycling. Yet numbers have fallen back almost to pre-pandemic levels for the reasons set out in Section 1. What we do know is that many more people will have been out on a bike for pleasure at some point over the last two years, and indeed that many new bikes have been purchased. This is still, therefore, an important opportunity to shift perceptions about the role and purpose of cycling, so that people who are happy to cycle for leisure trips are also able to do so for other purposes.
However, suggesting to people who cycle occasionally for leisure to then commute to work will be impossible for some and daunting for others. Barriers such as perceptions of inadequate infrastructure, equipment (bike and clothing), workplace facilities for storage and changing, and fitness levels need to be overcome.It does not have to be a leisure/work dichotomy however. If occasional cyclists can be encouraged to cycle more for a range of local purposes then, over time, confidence in cycling will grow, fitness levels adapt and perceptions of cycling change. This should bring the bicycle commute within reach for more people as shown in Figure 17.
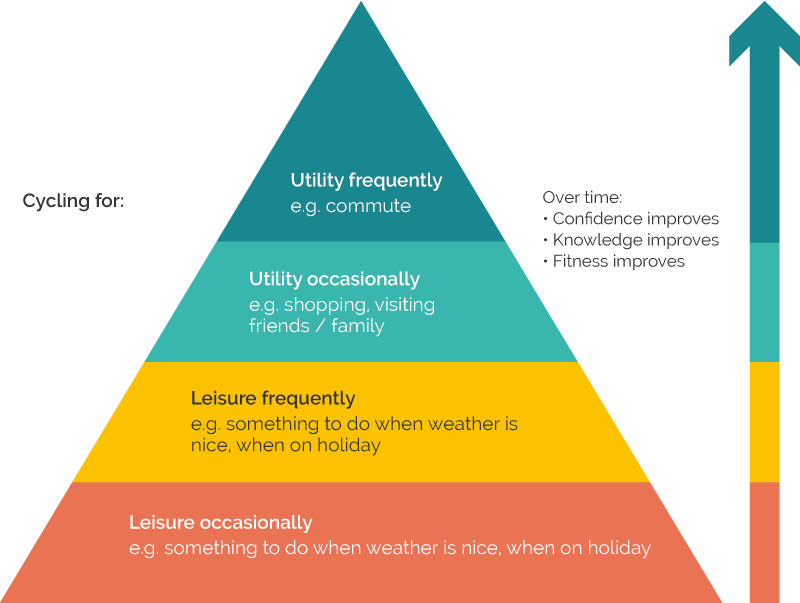
Image description
Over time, increased time spent cycling improves confidence, knowledge and fitness. Level one begins with occasional cycling for leisure, e.g. something to do when the weather is nice of when on holiday. Level 2 is cycling for leisure frequently. Level 3 is cycling for utility, occasionally, e.g. for shopping, visiting friends and family. Level 4 is cycling frequently for utility, e.g. commuting.
It is well established that better infrastructure, segregated from traffic, will be important to tackling concerns over safety. The early part of the pandemic also suggests that lower traffic is important to people’s feelings of safety when cycling. National and local plans are in place to expand on the quality of the infrastructure. This will all take time though. What is needed urgently is a concerted set of actions to encourage people to cycle more, particularly as the weather improves into Spring and Summer 2022. Actions such as community cycle groups, cycle buddying, workplace initiatives to promote facilities as people come back to the office, special events such as ‘Sky Ride’ and competitions within and between schools to increase bike to school behaviours can all be delivered at scale and quickly.
The combination of travelling to work less frequently, combined with more flexible ticketing and car parking policies might make the bike more of an option for some commute journeys in the week. The rise in on-line deliveries may also change what people feel they need to buy and carry. It will be important to understand if cycling can be incorporated more into post pandemic routines.
Recommendation 6: Revenue funding should be committed now to support locally-led campaigns and interventions to encourage people back to more regular cycling and to try new facilities.
Action 5: Tackle the rise in light goods vehicle traffic
The pandemic has shown a substantial increase in home shopping for both food and non-food items. The increase is already around one-third more than it would likely have been without the pandemic. This trend has been accelerated, and it has not peaked yet.
Currently, demand for on-line services is largely being left to the market to sort out. Companies are competing on speed of delivery and, whilst this often comes at a cost premium, this is not always the case. Companies are also seeking to lock consumers in to single platforms with ‘smart passes’ which provide unlimited free deliveries for a low annual fee. This limits the potential to coordinate deliveries to adjacent areas to reduce delivery miles. If consumers do not face the real cost of next day (or quicker) delivery at the point of payment, then it should not be surprising if this becomes the default option. Light goods vehicle traffic was the fastest rising source of traffic before the pandemic. It rose 8% in 2021 despite lockdown restrictions, whilst car traffic fell. The average CO2 emissions of light goods vehicles are higher than those of private cars. The social benefits of greater home delivery come with costs to local amenity and to carbon and air quality. Whilst there have been strategies announced for bus, rail, cycling and walking there is no sign of any policy effort to manage this issue.
One of the first steps of such a strategy should be to understand what the role of light goods vehicles are in the economy. It is very diverse. However, in our expert workshops, the best which transport authorities could do was tell us how many there were on their network (As part of the TRANSAS study the project team has shared insights from the panel survey with a range of local and national transport stakeholders at which key developments around travel behaviour were discussed). The purpose, the loading and the efficiency of use is all largely unknown.
Recommendation 7: National governments should conduct major studies to understand the growth in light van traffic and then develop strategies to manage it.
Action 6: Support a shift to lower car ownership
Section 1 of the report showed that people who work from home some or all of their working week use their cars less than people who don’t work from home. Alongside this, we saw the largest shift in car ownership occurring in multi-car households becoming single car households. Changing where people spend their time and how often they travel is an opportunity for reconsidering car ownership.
There are trade-offs to be made in deciding on hybrid working arrangements. The cost of owning a car is, on average, 61% of the total cost of motoring, with the balance being fuel and parking costs. The balance between the costs of owning cars and commuting and the savings from working from home will matter.
This also requires decisions about the allocation of space at home, the availability of equipment and domestic heating. These are areas where company policies also matter. Perhaps rather than the company car being an employment perk, the incentives or workplace benefits could be offered for enhanced home working space, decarbonising heating or domestic insulation (which would fulfil a wider purpose).
Reducing car ownership could be supported by greater use of car clubs where people can access a car for the occasional times when additional cars are required and e-cargo bikes which can be used for shopping and childcare trips. Homeworking will be more sustainable if communities have good local facilities so that they do not need to keep cars to access them. These moves would also be supported by the shift to better and more walkable neighbourhoods we highlight above.
Recommendation 8: Employers, HM Treasury, HMRC and the Department for Transport should work together to create a new set of incentives to replace company car benefits, lock in lower motorised travel and support the shift to decarbonising domestic property.
2.2 Longer term issues
Perhaps the most important lessons to take from the experience of travel during the pandemic is that society has proven much more adept at changing not just how we travel, but also how much we travel when required to do so. The economy has now returned to pre-pandemic levels of output but with weekday car traffic nearly 10% down on 2019 levels. Although the financial sustainability of public transport is of obvious concern, we should not lose sight of the fact that we have, albeit by accident, achieved a larger decoupling of car use from GDP than would have been thought possible.
Will what we have learnt during the pandemic be used to re-evaluate the role of travel in society and in supporting the economy? How will we use those lessons to help construct a better way forward, which helps tackle the grand challenges we face in terms of decarbonisation and tackling social inequality, in ways which pre-pandemic policy actions did not? There are many areas of potential debate but we focus on two of particular importance:
Are the economic models that drive transport planning decisions fit for purpose?
It is essential to ask whether the fetish for expensive, long-term investments which deliver relatively small journey time benefits for commuters and business travellers needs re-evaluating. We have just demonstrated that parts of the economy can work quite differently without relying on this. The pandemic has changed labour markets in ways and at a scale and pace that dwarfs transport infrastructure plans. Whilst journey time will continue to matter, there are now different choices about whether travel is necessary at all for parts of the economy.
It would be a highly salutary lesson to revisit the ‘business cases’ for many of the key investments to see how they would stand up in the future of widespread hybrid working we are likely to see. Indeed, it is increasingly accepted that less car traffic is an essential part of meeting our overall climate goals (Transport Scotland, 2022; Hopkinson et al, 2021).
Scenario approaches to transport decision making are now becoming increasingly important in transport decision-making, and these provide a test of how robust proposals are to new ways of working (Transport Scotland, 2021). However, we need to move beyond asking whether our old schemes are still ‘OK‘ in appraisal terms and ask whether they are the schemes which best meet the needs of a changing society? Scenarios should improve appraisal processes by improving the quality of evidence on which choices between options are made. Used properly, they should also ensure that the right options come forward. There are, however, significant interests in pushing forward infrastructure schemes that have often been in the planning stage for many years. We would expect the pandemic behavioural response, coupled with the climate crisis, to generate a major shift in our investment priorities. Will it?
What have we learnt about societal resilience and the role of travel?
There will inevitably be a desire to ‘move beyond’ the pandemic in public discourse, but it is essential that we learn from it in order to be more resilient to future shocks, including fuel price rises, recession and supply chain disruptions. We really have seen that ‘less is more’ in many circumstances: the accessibility of key services locally, and easily accessible by foot or on bike, has been essential. The replacement of large elements of commuting by digital connectivity and hybrid working was the foundation stone of adaptive capacity for individuals and businesses. These adjustments initially involved significant costs by all and it is crucial, for both ongoing carbon reduction as well as resilience to future shocks, that they are maintained as part of business as usual in the daily lives of many people.
The negative emotional impacts of restrictions on our ability to meet friends and family and the importance of – often low paid – key workers being able to access their workplaces by public transport are just some of the crucial social needs the pandemic revealed which transport policy has either underestimated, undervalued or both. Have decision-makers understood what society values and needs most, what aspects of daily life are most and least adaptable? The evidence suggests not.
The recent IPCC report on climate impacts (IPCC, 2022) reinforces the inevitability of more extreme climate events both in the UK and overseas. The need for a new national adaptation strategy to face up to these realities has been underlined by the Chief Scientific Advisor to the UK (Vallance, 2022). The forthcoming UK Climate Adaptation Plan needs to look beyond simply infrastructure adaptation and take seriously the need to plan for societal adaptation. Such a plan should not just be about how to respond in a hurry, but also how to reduce our exposure to risk over time by living differently.
Whatever the source of the next significant disruption to society, the further we travel and the more frequently we are required to travel, the more exposed we are to risk from such events. As we write this in early March 2022, petrol and diesel prices have reached ‘record highs’ and are predicted to rise further. The best way to reduce the impact of these price rises is a proactive strategy to reduce the need to travel and use private cars.
What could this look like? More investment in 15 or 20 minute neighbourhoods, more flexible public transport ticketing and parking permits, developing a network of community collection points or delivery hubs, more home working options for more employees, better public realm and the reallocation of roadspace away from the car, better digitisation of education and health settings are some of the things which the pandemic tells us could work and would help. Many lessons are shared with other disruptions (Disruption Project, 2016). If we could switch away from a paradigm where the only view of development is ’more economic growth means more traffic‘ to one where we do not have to travel so far or so often but can still do the things we want, less really could be more. Then we may have learnt some of the transport and societal resilience lessons from the pandemic. Will we?
References
Show all references
- Anable, J. and Marsden, G. 2021. Covid-19 Transport, Travel and Social Adaptation Study: Understanding behaviour change with neighbourhood characteristics. Centre for Research into Energy Demand Solutions. Oxford, UK. ISBN: 978-1-913299-12-5
- BBC News, 2021. TfL services may be cut due to funding gap, mayor warns. London: BBC.
- Brand, C., Anable, J. and Marsden, G. 2021. The role of energy demand reduction in achieving net-zero in the UK: Transport and mobility. Centre for Research into Energy Demand Solutions. Oxford, UK.
- Chatterjee, K., Clark, B. Nguyen, A., Wishart, R., Gallop, K. and Smith, N., Tipping, S. 2019. Access to transport and life opportunities. London: Department for Transport, Crown Copyright.
- Cook, C. 2022. UK high streets bounce back from Covid curbs as London falters (paywall). London: Financial Times.
- DfT, 2020b. Gear change: A bold vision for cycling and walking. London: Crown Copyright.
- DfT, 2022. Transport use during the coronavirus (COVID-19) pandemic. London: Crown Copyright.
- DfT, 2022b. National travel survey. London: Crown Copyright.
- DfT, 2022c. Over £150 million provided to safeguard local transport services as the country emerges from the pandemic. London: Crown Copyright.
- Disruption Project, 2016. Fleximobility: Unlocking low carbon travel.
- DLUHC (Department for Levelling Up, Housing & Communities), 2022. Levelling up the United Kingdom. London: Crown Copyright.
- Hook, A., Court, V., Sovacool, B.K. and Sorrell, S. 2020. A systematic review of the energy and climate impacts of teleworking. Environmental Research Letters, 15 (9): 093003. doi: 10.1088/1748-9326/ab8a84
- Hopkinson, L., Anable, J., Cairns, S., Goodman, A., Hiblin, B., Kirkbride, A., Newson, C. and Sloman, L. 2021. The last chance saloon: we need to cut car mileage by at least 20%. Radical Transport Policy Two-Pager #10. Transport for Quality of Life.
- IPCC, 2022: Climate Change 2022: Impacts, adaptation, and vulnerability. Contribution of Working Group II to the Sixth Assessment Report of the Intergovernmental Panel on Climate Change [H.-O. Pörtner, D.C. Roberts, M. Tignor, E.S. Poloczanska, K. Mintenbeck, A. Alegría, Craig, S. Langsdorf, S. Löschke, V. Möller, A. Okem, B. Rama (eds.)]. Cambridge University Press. In Press.
- Kalmeiher, S., Götschi, T., Cavill, N., Castro Fernandez, A., Brand, C., Rojas Rueda, D., Woodcock, J., Kelly, P., Lieb, C., Oja, P., Foster, C., Rutter, H .and Racioppi, F. 2017. Health Economic Assessment Tool (HEAT) for walking and for cycling. Copenhagen: World Health Organization.
- Lee, I.M. and Buchner, D.M. 2008. The importance of walking to public health. Medicine & Science in Sports & Exercise, 40 (7 Suppl): S512-8. doi: 10.1249/MSS.0b013e31817c65d0.
- Marsden, G., Dales, J., Jones, P., Seagriff, E. and Spurling, N. 2019. All change? The future of travel demand and the implications for policy and planning. First Report of the Commission on Travel Demand. ISBN: 978-1-899650-83-5
- Marsden, G., Anable, J., Docherty, I., Brown, L. 2021. At a crossroads: Travel adaptations during Covid-19 restrictions and where next? Centre for Research into Energy Demand Solutions: Oxford. ISBN 978-1-913299-08-8
- Marsden G, and Docherty I. 2021. Mega-disruptions and policy change: Lessons from the mobility sector in response to the Covid-19 pandemic in the UK. Transport Policy, 110: 86-97. doi: 10.1016/j.tranpol.2021.05.015
- OBR, 2021. Economic and fiscal outlook – October 2021. London: Office for Budget Responsibility.
- ONS, 2022. Internet retail sales, £ millions. All retailing. London: Office for National Statistics. ONS, 2022b. Retail Sales Index internet sales. London: Office for National Statistics.
- ONS, 2022c. Residential property sales for administrative geographies: HPSSA dataset 6. London: Office for National Statistics.
- ONS, 2022d. Index of private housing rental prices percentage change over 12 months, UK and London. London: Office for National Statistics.
- Paths for All, 2019. National survey of attitudes and barriers to walking in Scotland. Stirling: Paths for All.
- Pidd, H. 2022. Fears of pandemic exodus from England’s cities prove unfounded. London: The Guardian.
- SMMT, 2022. Car registrations. London: Society of Motor Manufacturers and Traders. SMMT, 2022b. Used car sales data. London: Society of Motor Manufacturers and Traders. TomTom, 2022. TomTom traffic index. Amsterdam: TomTom.
- Transport Focus Data Hub, 2022. Covid-19 travel survey. London: Transport Focus.
- Transport Scotland, 2021. STPR2 approach to scenario planning – May 2021. Glasgow: Transport Scotland.
- Transport Scotland, 2022. A route map to achieve a 20 per cent reduction in car kilometres by 2020: 3. Interventions. Glasgow: Transport Scotland.
- Transport Scotland, 2022b. Advice on car and vehicle sharing. Glasgow: Transport Scotland. University of Birmingham, 2022. Car parking. Birmingham: University of Birmingham.
- UK Health Security Agency, 2022. Deaths within 28 days of positive test by date of death. London: Crown Copyright.
- Urban Transport Group, 2022. Continuing COVID funding support for urban public transport. Leeds: Urban Transport Group Limited.
- Vallance, P. 2022. UK storms show why we must adapt to live with climate change. London: inews.co.uk.
- Whitelegg, J. 2016. Walking the city. In: Planning after petroleum. Routledge, 95-107. ISBN: 9781315650715
- Zimmermann, A. 2021. Remote work can boost productivity and curb burnout. London: London School of Economics.
Publication details
Anable, J., Brown, L., Docherty, I. and Marsden, G. 2022. Less is more: Changing travel in a post-pandemic society. Centre for Research into Energy Demand Solutions. Oxford, UK. ISBN: 978-1-913299-15-6
Banner photo credit: Alireza Attari on Unsplash