
Greg Marsden, Jillian Anable, Kadambari Lokesh, Richard Walker, Shona McCulloch and Kay Jenkinson
Introduction
The Climate Change Act (2019) ‘commits the UK government by law to reducing greenhouse gas emissions by at least 100 per cent of 1990 levels by 2050’ [1].
This represents the UK’s contribution to the ‘Paris Agreement’ which sets out a global framework to limit global warming to well below 2°C and pursuing efforts to limit it to 1.5°C above pre-industrial levels [2].
The intergovernmental panel on climate change is clear that the current levels of warming are already causing environmental changes such as ecosystem loss, droughts, more intensive precipitation and sea level rise. The efforts to cut emissions are to limit the scale of future impacts.
In the context of this national picture and the urgency of action, many councils have declared climate emergencies. However, turning these declarations into credible and sufficient actions on the ground is challenging.
There has never previously been a concerted effort to simultaneously change technologies and behaviours on anything like the scale required.
Coordinated action is required between local, sub-national and national government, and between adjacent places. It will require partnership working with industry to create a new mobility system.
This briefing note sets out the framework within which councils can begin to deliver ambitious action plans. It explains some of the key issues surrounding carbon targets and budgets, and what levels of emission reductions are necessary to be consistent with the Paris Agreement.
This briefing is also part of a series, commissioned by the Local Government Association, which sets out what actions will be most effective for local government in the transport sector.
It sets out a framework of intervention types which can be used to cut carbon. There is a huge diversity in transport-related CO2 emissions between local authorities today, and very different options and opportunities available for different places to tackle the problem.
This briefing and the six accompanying briefings do not provide a prescription of what must be done, rather a menu of options, from which various measures will need to be combined – in place-appropriate ways – to deliver change.
What is clear is that the transport sector has to move from thirty years of failing to reduce its emissions to a rapid trajectory of emissions reduction. In order to comply with the Climate Change Act 2019 every council must get to zero emissions from transport, there are no free passes.
If some areas go slower in cutting emissions other areas will need to compensate and go faster, creating even more difficult policy choices.
The rate of carbon reduction required cannot be achieved anywhere simply through business as usual, nudges in behaviour, or tweaking policy priorities. This note is bounded by what the climate science demonstrates is required, not what would be easy to deliver.
This is a climate emergency.
Relevant policy strands
Climate Change Act 2008 [3], 2019 [4] This enshrines in legislation a requirement for the UK to ensure that the net UK carbon account for the year 2050 is at least 100 per cent lower than the 1990 baseline and to establish five year interim budget targets which are assessed by the committee on climate change.
Committee on climate change net zero The net zero report provides the scientific and policy case for setting a zero emissions target for the UK economy. It provides the link from the Paris Agreement to the amendment of the Climate Change Act 2008 [5].
Transport decarbonisation plan: setting the challenge In March 2020, the Department for Transport released the first part of its decarbonisation plan. The document sets out the case for action and the scale of the policy gap. It has seeded a period of consultation over the summer of 2020 with an anticipation of the final plan being published in late 2020 [6].
Key Facts [7]
Zero carbon, net zero or climate neutral?
Carbon neutral, climate neutral, net zero, zero emissions, and decarbonisation have all been used interchangeably in academia, policy and practice [9].
The specific terminology does make a difference to the level of ambition and carbon reduction implied, and councils are already taking diverging approaches to what they count. This section briefly explains the what and why of these terms.
Different greenhouse gases contribute to climate change in different ways. For example, methane has significant warming potential but is short-lived in the atmosphere. The majority of greenhouse gases are carbon dioxide (CO2) from the burning of fossil fuels and this stays in the atmosphere for a long time.
The UK government target of net zero for UK greenhouse gas (GHG) emissions by 2050 includes all emissions [10]. The majority (77 per cent) of all emissions are CO2 arising from the burning of fossil fuels and this is particularly true in the transport sector. It is therefore more transparent and traceable for local authorities to set transport targets for CO2 emissions [11].
Why do we need to get to zero?
The intergovernmental panel on climate change brings together scientific assessments of climate models which predict the relationship between total global emissions and climatic impacts.
Because emissions are long-lasting in the atmosphere, and are still rising, it is known that climate change will continue.
The Paris Agreement aims to keep global temperature rises well below 2°C. Above 2°C, the already severe impacts on flooding, droughts, sea level rise and temperatures will worsen, but with much greater uncertainty.
Reducing emissions to zero is necessary, therefore, to limit the rise in temperatures. This is now enshrined in UK law through the 2019 amendment to the Climate Change Act 2008 [12].
Why do we talk about ‘net’ zero?
Zero emissions would mean no production of any greenhouse gas emissions at all. There are some sectors (e.g. farming and aviation) where it is anticipated this will not be possible.
Net zero therefore allows for a small amount of residual emissions to be produced, but requires the UK to find so called ‘negative emissions technologies’ which can take carbon out of the atmosphere to compensate. These measures can include planting trees, rewilding, bioenergy with carbon capture and storage.
It is important to note that there is no anticipation that any surface transport emissions will be in the ‘too difficult to cut’ bucket which will be netted off. Net zero means zero emissions for surface transport.
International aviation and shipping emissions are assessed by the UK government but are subject to international conventions rather than forming part of the UK’s territorial emissions. In theory, councils therefore would only be required to tackle landside emissions at ports and airports.
In reality, citizens see the inconsistencies between restrictions and adaptations to their daily lives and the expansion of aviation and airports. Transport strategies for councils cannot avoid addressing this.
Engaging citizens in decarbonisation
The declaration of a climate emergency and the setting of targets and trajectories is part of a process of recognising a need to act differently.
One option which many councils are using to understand how to deal with the difficult choices this brings is through community engagement. For example, the Leeds Citizens jury on climate change was established after Leeds City Council declared a climate emergency in March 2019. In November 2019 the recommendations of the jury were released.
Transport featured as the number one priority with measures being proposed for private cars to become the mode of last resort. Also in the top 10 was opposing any expansion of Leeds Bradford airport Expansion [13]. The national climate assembly will also report to parliament in the Summer or Autumn of 2020.
Why carbon budgets and not just carbon targets?
Because CO2 accumulates in the atmosphere over time, it is the total amount of emissions over the period to 2050 which matters.
The committee on climate change sets carbon budgets for the UK for five-year periods, with the next five year budget period to be announced later in 2020 out to 2037. This will need to reflect the change in ambition implied by the climate change act amendment 2019.
There is no science to picking an end year where emissions are zero. Setting a target year by which emissions will be zero can be symbolically important. However, what counts is the trajectory of the commitments to carbon reduction between now and the target zero emissions year. This defines the actual level of emissions reduction being promised over the budget period. This is what matters to climate change [14].
There are currently no formal budgets set sector by sector. It has always been argued that to do so would be distortive, as the costs of decarbonising in one sector might be cheaper than another, which targets may not reflect.
However, this argument is less relevant today as all sectors now have just 30 years to decarbonise, and to do so almost completely.
This is particularly true of transport, which formed just 21 per cent of CO2 emissions nationally in 1990 but is now 33 per cent of UK CO2 emissions [15]. The decarbonisation trajectory for transport can no longer lag behind the overall trajectory.
In 1990 (the baseline year for carbon assessments) domestic emissions from transport were at 125.4 MtC and by 2018 this had fallen to just 121.4 MtC.
This corresponds to an annual emissions reduction rate of just 0.13 per cent. To put this in context, if this continued, it would take 954 years to decarbonise the sector.
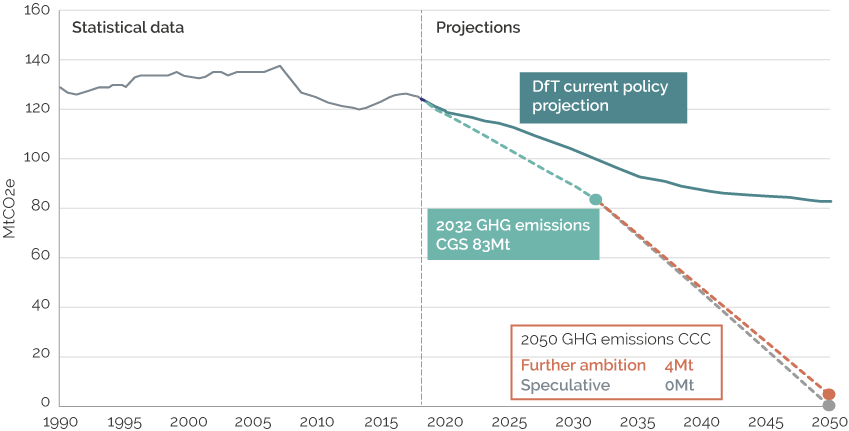
In the recent Department for Transport publication ‘Decarbonising transport: setting the challenge’ an assessment was made of the gap between what existing policies could deliver and the carbon pathways implied by the clean growth strategy and the net zero 2050 end goal.
The figure below shows the scale of the challenge we now face, due to decades of insufficient action on transport emissions.
Decarbonising transport: setting the challenge
The emissions reduction trajectory implied by the Department for Transport’s analysis is an annual rate of at least 5 to 6 per cent [17].
Research by the Tyndall Centre, which is being used by some councils, suggests that more rapid action is needed earlier in the budget period and that emissions reductions of around 12 to 14 per cent will be required [18].
Further clarification on carbon budgets will emerge in late 2020 when the Committee on Climate Change publishes its first carbon budget analysis since the 2019 Climate Change Act. The committee has already acknowledged a bigger carbon budget gap over the coming decade than previously thought [19].
So, it is clear that the transport sector needs to move very swiftly from a position of no annual reductions to at the very least five per cent per annum. This requires a huge step change in performance.
What should targets and trajectories be set for?
Research for the DecarboN8 network has examined the commitments of the 182 English councils that had declared climate emergency as of May 2020. Of these, just over one quarter (27.5 per cent) have set carbon targets for county-, borough- or city-wide activities and infrastructure across all activities.
Fewer than one in ten (8.2 per cent) have set a specific transport emissions reduction target for the county/borough level, and not all of these have interim budgets.
A further one in five (19.2 per cent) have set targets only for own council operations and buildings. Around forty per cent of authorities that have declared a climate emergency have done so without setting any targets.
It is important councils set targets for their own activities. Leadership in decarbonisation is a key role for local authorities.
However, own activity emissions is a relatively small fraction of total emissions and if an authority acts as the highways authority or local transport authority for an area then it should also set targets for decarbonising all travel in its area. Transport targets should be clear, but also connected to a whole economy-wide approach.
The setting of targets is a challenging technical process. Should local authorities count the emissions of their residents and businesses, no matter where in the UK those emissions occur? Should they look only at emissions from activities that have a destination in their area? Or should they include all movement within their area wherever its origin and destination?
These differences are important. It is argued, for example, that the shift in manufacturing overseas explains why the industry emissions sector appears to have performed well in carbon terms. Consumption-based emissions methods can account for this.
Each approach has benefits and drawbacks. However, the international convention is to account for emissions at a territorial level.
The best approximation to this currently is produced using the National Atmospheric Emissions Inventory (NAEI) which works on the basis of assigning emission estimates to traffic flows within an area [20].
It is important to consider at what spatial scale to set the budget and targets. The smaller the spatial scale the greater the proportion of emissions will be that are just passing through. The larger the spatial scale the further from local democratic processes or citizen engagement processes the accountability for emissions action might be held.
Councils should work together to understand the right spatial scale for setting targets at. Evidence-based guidance on target setting for local authorities is provided by the Tyndall Centre.21
How different are local authorities?
Travel patterns for work, business, tourism and goods movement differ substantially across the country. The transport networks which are available to service the mobility needs of different areas also vary significantly. It should be no surprise therefore that the starting point on carbon emissions also varies substantially.
Using estimates from the NAEI, the data suggests that the highest emitting authorities have emissions of around ten times those of the lowest emitting authorities (ignoring contributions from motorway traffic) as shown below.
Analysis for the DecarboN8 Research Network and the Centre for Research into Energy Demand Solutions (CREDS), found that looking from an ‘all residents’ mileage perspective, the variation from lowest to highest is a factor of six, lower than for NAEI but still very substantial [22].
| Highest districts | Kg CO2 per head | Lowest districts | Kg CO2 per head |
|---|---|---|---|
| City of London | 5,514 | Barrow-in-Furness | 518 |
| Rutland | 4,110 | Camden | 512 |
| Eden | 3,769 | Hackney | 490 |
| Daventry | 3,434 | Harrow | 461 |
| Ryedale | 3,391 | Islington | 455 |
| West Devon | 3,373 | Isles of Scilly | 218 |
The findings on carbon base lining are not surprising:
- Emissions per capita are typically higher in rural areas with fewer transport options.
- Emissions in larger cities are usually lower per capita due to better transport networks, lower car ownership amongst those less well-off and some wealthier city centre residents, particularly in inner London.
- Places with a history of demand restraint and higher cycling levels because of historic city centres have relatively low per capita emissions.
However, the variation in emissions within each type of authority [24] (e.g. countryside living), is typically larger than the variation between different types of authority (e.g. urban settlements; business, heritage and education; services and industrial legacy) [25].
This implies that there are opportunities, whatever type of council you are, to make progress on decarbonising transport now.
What are the options?
There are three broad categories of intervention which can deliver the decarbonisation of transport:
- Less travel can be undertaken [26] (sometimes referred to as Avoid actions)
- More of the travel that is undertaken is by public transport and active modes [27] (Shift actions)
- The emissions of motorised transport are reduced to zero [28] (Improve actions)
As everywhere needs to decarbonise and to make progress in a hurry, actions across all of these areas is essential. What will differ between councils is the balance between the different options, given, for example the range of mode shift opportunities which exist.
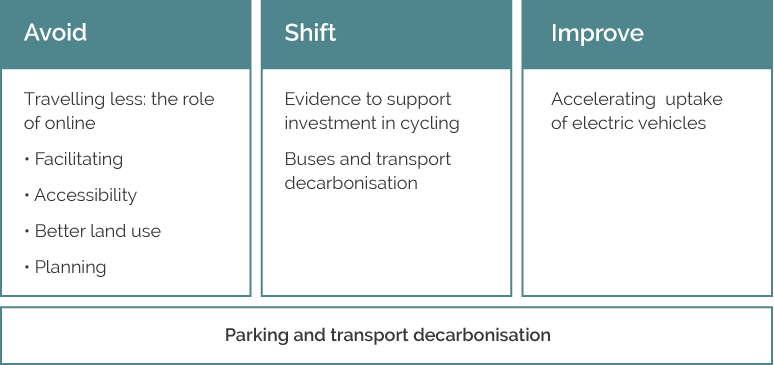
The series of briefing notes commissioned by the Local Government Association has been organised using the Avoid, Shift, Improve framework as shown in figure 6.
The policies shown represent the highest priority areas for action identified by LGA member participants during two workshops in early 2020.
Whilst not every policy intervention fits neatly into one pillar (e.g. parking) it is still a useful organising tool. A range of other policy interventions exist, and case studies can be found on the Local Government Association website and elsewhere [29].
Local Government Association decarbonising transport briefings
A blend of different measures will be necessary everywhere. This needs to be tied in to thinking about the required carbon emissions reduction trajectory and progress across the whole period as well as to wider transport policy concerns.
To illustrate the importance of the portfolio of actions over time, consider the case of electrification, where it is now likely that all new vehicles sold will be electric by 2035 or slightly earlier.
New car sales of electric vehicles are around 5 per cent of all cars sold and this will ramp up year on year. However, vehicles have a lifespan of around 12 to 15 years and so the fleet will remain powered, in the main, by internal combustion engines for much of the next decade.
Even the most optimistic adoption pathways for EVs are likely to also require 20 per cent or more reductions in absolute travel demand to be on track with emissions reduction goals [30].
Cutting travel demand would though be very challenging without a change to how people pay to travel, given that the per mile costs of driving an electric car are much lower than those for petrol or diesel engine cars. Integrated thinking and action is essential.
Whilst the focus of these notes is on the decarbonisation challenge, every transport intervention impacts on multiple dimensions of policy.
The ‘co-benefits’ or ‘negative side-effects’ of the decarbonisation policy portfolios which are put together need to be considered in the round.
Getting more people travelling on foot or by bike has considerable health benefits as well as cutting emissions.
Moving large volumes of people by public transport cuts congestion and allows local authorities to free up road space for active travel or economic activity rather than for moving cars.
Electric vehicles are better than internal combustion engines in terms of air quality and emissions, but they do nothing to address congestion, safety or space concerns.
The right mix of solutions will vary within as well as between local authorities. The briefing notes produced in this series provide evidence-led ideas for change, but they need to be embedded in a local context.
What ambition is required?
Once a climate-science led approach to trajectory setting has been followed, and an annual emissions target set, the scale of the challenge will be laid bare.
As noted above, this is likely to mean reductions of at least 5 per cent per annum every year and maybe more. For every year where progress is slow, the rates for future years will need to be even higher in order to compensate.
It is also important to consider that, should one council decide that decarbonising early is too difficult or too expensive, then the implication is that other areas must decarbonise even faster to fill the gap.
To illustrate what the decarbonisation challenge might mean, we use an example from research conducted in Scotland to meet the 80 per cent target, i.e. before Net Zero [31].
Here, research looked at a lifestyle change scenario, a vehicle electrification scenario, and a combined scenario. It is only in the combined scenario that the results approached the kinds of outcomes required. The changes necessary included:
- A 5 per cent reduction in the number of trips made by 2050.
- A 2.5 per cent reduction in distance travelled by 2030 and 13 percent by 2050.
- A 10 per cent reduction in car mode share from 71 per cent to 61 per cent in 2030 and 41 per cent in 2050.
- A doubling of distance travelled by active modes to 8 per cent by 2030 and 17 per cent by 2050.
- An increase in distance travelled by bus and rail from 15 per cent to 19 per cent by 2030 and 28 per cent by 2050.
- 66 per cent of all new car sales to be battery electric or plug-in hybrid vehicles by 2030.
These kinds of changes are on a scale that the UK has never yet achieved to tackle congestion or air quality concerns. They cannot be achieved through incremental changes to existing policy packages and through nudging people to make slightly different choices.
This level of systemic change requires investment in new options, but also a good deal of local political bravery and engagement with people to create a vision of a zero carbon future which communities benefit from.
Conclusion
We are facing a climate emergency. This briefing note sets the context for what this means for councils tasked with creating a pathway to a zero carbon future.
The message is stark. The levels of change to travel behaviour are unprecedented and will need to happen at the same time as planning for a shift to an all electric vehicle fleet.
While the balance of interventions will differ between places, decarbonisation needs to happen rapidly and everywhere. Technology change alone is not enough.
While we focus here on the carbon imperative, we also point to the wider benefits or side- effects policies can have, and stress the importance of having an integrated transport strategy which has decarbonisation at its core, rather than seeing carbon as an add-on.
This note sets out a framework of actions which councils can take today to reduce travel demand, reduce car mode share and accelerate the adoption of electric vehicles.
Six further briefing notes provide more detailed evidence-led suggestions for the kinds of options that might be adopted and their carbon benefits.
Councils should urgently progress what they can achieve and start a downward emissions trajectory which they can accelerate.
There is an urgent need to review and stop doing some of the things which councils and highways and planning departments have always done which are not consistent with climate emergency.
If the future depends on reducing travel demand and reducing the dominance of car mode share then the case for expanding roads is, at best, short-term. Similarly, building new car dependent housing simply adds to the scale of the challenge.
It seems unlikely that authorities will, from day one, be able to deliver the levels of emission reductions implied by their climate assessments.
Where there are gaps between what councils can achieve with the tools and funding they have today, they must assess what is required from national government or other actors to change that position, and work together to ask for it. There is no time to settle for less.
The forthcoming national decarbonising transport strategy will undoubtedly provide more resources and tools, but it will not have all of the answers.
Delivering a zero carbon future for transport will require a huge collaboration between citizens, industry and government.
Decarbonisation happens in places and so councils will be key actors in brokering and delivering this vision.
Notes
This briefing is part of a series written for the Local Government AssociationOpens in a new tab (LGA) and was first published on their website.
DecarboN8 has received funding from UK Research and Innovation under grant agreement EP/S032002/1.
Figure 1: In 1990, transport as a percentage of all UK emissions was 21 per cent, whereas in 2018 it was 33 per cent.
Figure 2: UK greenhouse gas emissions for all transport accounts for 33 per cent of total emissions, including road, air and shipping. Surface transport accounts for 23 per cent of emissions, surface passenger transport emits 25 per cent of all GHG emissions.
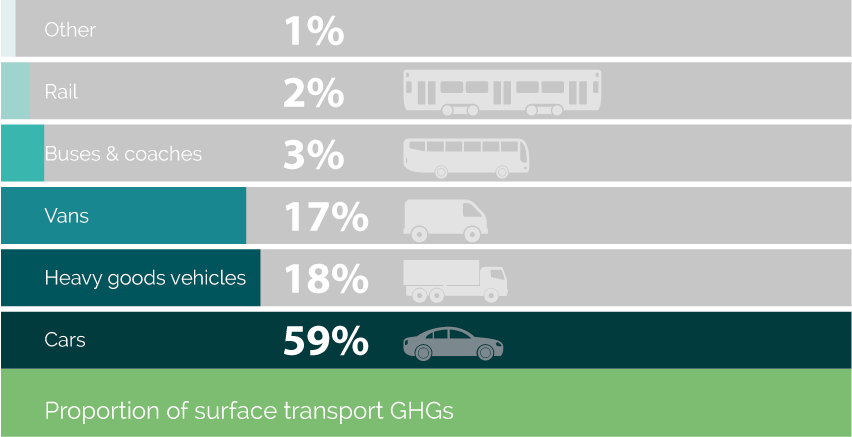
Figure 3: Greenhouse gas emissions emitted by mode of transport: cars 50 per cent, heavy good vehicles 28 per cent, vans 17 per cent, buses and coaches 3 per cent, rail 2 per cent, other 1 per cent.
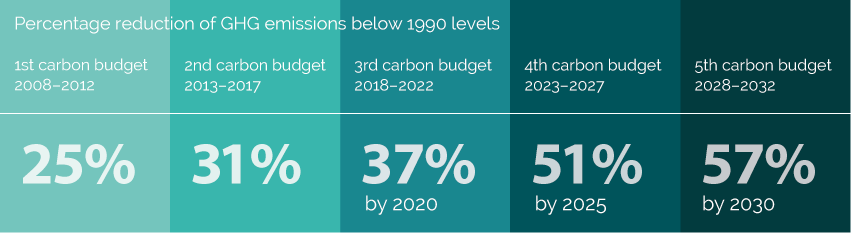
Figure 4: Percentage reduction in greenhouse gas emissions below 1990 levels for the UK. First carbon budget 2008 to 2012 aimed for 25 percent, second carbon budget 2013 to 2017 aimed for 31 per cent, third carbon budget 2018 to 2022 aimed for 37 per cent reductions, fourth carbon budget 2023 to 2027 aims for 51 per cent, fifth carbon budget 2028 to 2032 aims for a 57 per cent reduction.
Figure 5: There is a gap between existing transport policies and a net zero pathway. Current policy projections from the Department for Transport show likely GHG emissions of 83 MtCO2 in 2050, while the fifth carbon budget aims to reach 83 MtCO2 by 2032 and an ultimate aim of only 4 MtCO2 by 2050.
Figure 6: The Avoid element of the Avoid, Shift, Improve framework include travelling less, facilitating, accessibility, better land use and planning. The Shift element includes evidence to support investment in cycling, and buses and transport decarbonisation. The Improve section features accelerating uptake of electric vehicles.
References
- Amendment to the Climate Change Act 2008Opens in a new tab
- European Commission (2019). Paris AgreementOpens in a new tab
- Climate Change Act 2008Opens in a new tab
- Climate Change Act 2008 (2050 Target Amendment) Order 2019Opens in a new tab
- CCC (2019). Net Zero – The UK’s contribution to stopping climate changeOpens in a new tab
- Department for Transport (2020). Decarbonising transport: Setting the challenge, pdfOpens in a new tab (80 pages, 5 MB).
- Department for Transport (2020). Decarbonising transport: Setting the challenge, and BEIS (2019), 2018 Greenhouse Gas Emissions, Provisional Figures.
- Carbon budgets are explained later in the briefing note but a fuller accessible discussion can be found in the House of Commons briefing paperOpens in a new tab
- Kuriakose, J., Gough, C., Mason, J. and Moore, B. (2019). Setting climate targets: when is net zero really net zero?Opens in a new tab
- Office for National Statistics (2019). Net zero and the different official measures of the UK’s greenhouse gas emissionsOpens in a new tab
- Kuriakose, J., Gough, C., Mason, J. and Moore, B. (2019). Setting climate targets: when is net zero really net zero?
- Climate Change Act 2008 (2050 Target Amendment) Order 2019Opens in a new tab
- Leeds Climate Change Citizens’ Jury – Summary of RecommendationsOpens in a new tab
- Jackson, T. (2019). Zero Carbon Sooner—The case for an early zero carbon target for the UK. CUSP Working Paper No 18. Guildford: University of Surrey.
- BEIS (2019). 2018 Greenhouse gas emissions, provisional figures, pdfOpens in a new tab, includes international transport emissions (22 pages, 669 KB).
- Department for Transport (2020) Decarbonising Transport: Setting the Challenge.
- The trajectory set in the Clean Growth Strategy was for an 80% reduction pathway and so the percentage figure quoted is for the 2032-2050 period which uses the net zero end point.
- Kuriakose, J., Anderson, K., Broderick, J. & Mclachlan, C. (2018). Quantifying the implications of the Paris Agreement for Greater ManchesterOpens in a new tab
- CCC (2020) Reducing UK emissions: 2020 Progress Report to ParliamentOpens in a new tab
- National Atmospheric Emissions InventoryOpens in a new tab
- University of Manchester (2019). The Tyndall Carbon Budget ToolOpens in a new tab
- DecarboN8 podcast (2020). Place based decarbonisationOpens in a new tab
- Data.gov.uk (2020). Emissions of carbon dioxide for Local Authority areasOpens in a new tab
- Office for National Statistics (2011). 2011 residential-based area classificationsOpens in a new tab
- DecarboN8 project websiteOpens in a new tab
- Marsden, G., Dales, J., Jones, , Seagriff, E. and Spurling, N. (2018). All Change? The future of travel demand and the implications for policy and planning, pdfOpens in a new tab (64 pages, 869 KB).
- Greener Journeys (2014). Driving modal shift from car to busOpens in a new tab
- Department for Transport (2018). The Road to ZeroOpens in a new tab
- Arup. (2020). You’ve declared a climate emergency… Next steps: TransportOpens in a new tab
- Hopkinson, L. and Sloman, L. (2018) More than electric carsOpens in a new tab
- Brand, C., Anable, J. and Morton, C. (2018). Lifestyle, efficiency and limits: modelling transport energy and emissions using a socio-technical approach. Energy Efficiency.
Publication details
Marsden, G., Anable, J., Lokesh, K., Walker, R., McCulloch, S. and Jenkinson, K. (2020). Decarbonising transport: getting carbon ambition right Opens in a new tab Local Government Association: London. Open access
Banner photo credit: Alireza Attari on Unsplash