
Richard Walker, Morgan Campbell, Greg Marsden, Jillian Anable, Shona McCulloch and Kay Jenkinson
Introduction
Buses are a critical part of transport decarbonisation strategies for councils across England. In 2018, buses carried 5 per cent of all trips; analysis of ambitious but balanced pathways to a zero-carbon transport system suggests this needs to increase to around 10 per cent of all trips by 2050 [1]. To achieve this uptake, progress must be part of early local decarbonisation strategies.
Dependent on loading, buses are the most space-efficient road passenger vehicle. They are already a low carbon mode of transport and by transitioning the fleet to low and ultra-low emission vehicles, buses quickly become even more carbon efficient.
The case for buses goes well beyond carbon impacts to congestion benefits, managing limited space, and providing an essential socio-economic service. In 2018, 24 per cent of households did not have access to a car or van, and a further 41 per cent of households had access to only one car or van.
Some places in England, such as Oxford, Brighton and York are illustrative of what ‘turn up and go’ bus networks are capable of delivering as part of an overall transport system carefully managed by the local authority.
However, the bus network has overall been in a period of slow but steady decline.
This situation was unsustainable both financially and in terms of helping deliver the UK’s zero-carbon ambitions. In February 2020, the Government announced its intention to produce a National Bus Strategy for England and launched an immediate package of measures to try to revive bus use.
Unfortunately, this announcement coincided with the arrival of the coronavirus emergency. This is a perilously difficult time for the bus industry and bus policy. Keeping the industry running, serving communities and key workers is the immediate priority.
A once-in-a-generation scale additional subsidy is needed to make this possible. This investment must be used to strengthen and rebuild the partnerships of those providing, supporting, and using bus services.
This will, in turn, strengthen local transport decarbonisation strategies. The carbon imperative will not go away; if the revival of bus use cannot be brought about then it will be harder to shift more trips away from the car. Whilst the significance of the bus varies across different areas, there are also opportunities to do more in every area.
Relevant policy strands
‘A better deal for buses’ (February 2020) is the Government’s most recent policy statement on buses. The document promised: a National Bus Strategy, a review of the bus service operators grant, £30 million for supported bus services, a one-year pilot of a lower fare network in Cornwall, challenge funds for Britain’s first all-electric bus town, and for new demand responsive services in rural areas.
Emergency funding for the bus network is being delivered through the COVID-19 Bus Service Support Grant (CBSSG), of which an element goes to councils to maintain tendered services.
The Bus Services Act 2017 is the most recent bus legislation and, among other things, provides the legal framework governing bus quality partnerships and the process for the re-regulation of bus services in England outside London (‘bus franchising’). The Transport Acts 1985 and 2000 remain the basic legislation governing the regulation of the bus industry.
The Future of Transport Regulatory Review is under way (consultation closed July 2020) and will consider among other things the regulatory framework for buses, taxis and private hire, and for flexible (‘demand responsive’) bus services.
Key facts
Carbon efficiency
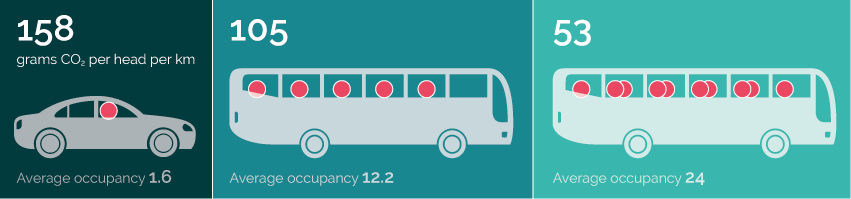
The bus is among the most carbon efficient modes of passenger transport, even at the pre-coronavirus (2018–19) average passenger loading of 12.2 people on the bus at any given time over the course of the operating day. Battery electric buses have a similar advantage over electric cars in terms of lower emissions per passenger-kilometre.
However, the main opportunity for the bus to reach its potential in terms of reducing emissions per passenger-km is to increase the average passenger loading on buses. Even modest increases in passenger load would yield significant improvements in carbon performance.
| Vehicle emissions per km | Per head at (existing average vehicle occupancy) | Per head at (achievable increased average vehicle occupancy) | |
|---|---|---|---|
| Medium-sized petrol car 2020 (whole life emissions/km) | 253 | 158 (1.6) | 127 (2) |
| 2019 fleet average petrol car (fuel consumption only) | 174 | 109 (1.6) | 87 (2) |
| 2019 fleet average diesel car (fuel consumption only) | 168 | 105 (1.6) | 84 (2) |
| 2019 fleet average diesel bus (fuel consumption only) | 1,282 | 105 (12.2) | 53 (24) |
| Medium-sized electric car in 2020 eg Nissan Leaf (whole life emissions/km, EU average CO2/ kWh electricity) | 91 | 57 (1.6) | 46 (2) |
| Dennis Enviro200 battery electric bus, currently in service in London, capacity 65 passengers (power consumption only) | 438 | 36 (12.2) | 18 (24) |
Demand for bus travel
In 2019, 4.3 billion bus passenger journeys were made, accounting for 6 per cent of all journeys over one mile and over 8 per cent of journeys between 2 and 10 miles in length [3]. Over twice as many trips are made by bus than are made by rail.
Just over half of all bus journeys in England were in London (2.2 billion). Outside London, 0.9 billion journeys were in metropolitan areas and 1.2 billion were in non-metropolitan areas, the latter figure illustrative of the fact that buses are not just an urban solution.
People in rural areas and villages use the bus to travel significantly further distances than those in urban and metropolitan areas. In fact, 25 per cent of all school trips in rural villages are made by local bus – a higher proportion than those in non-rural areas [4].
Differences in bus use between places
There is large variation in bus use across England. The average number of bus journeys per person per year in England outside London is 45, but this varies from 172 in Brighton to just 9 in Rutland. Bus use in England outside London has fallen by 12 per cent since 2008–09 and has been falling in London since 2013–14. However, 18 out of the 88 local transport authorities in England saw growth in bus use in the past decade.
Densely populated towns and cities, and places with lower levels of household car ownership tend to have the highest levels of bus use. Traditionally, this would have been associated with places that are less well off. In recent years, however, bus use has tended to grow strongest in towns and cities that are economically more prosperous or have a large student population.
Places with relatively high levels of car ownership and high levels of bus use include Poole-Bournemouth, West of England, Oxfordshire, and Surrey. Places with relatively low levels of bus use compared to their level of household car ownership include Lincolnshire, Staffordshire, and East Sussex.
The key message is that what councils and bus operators do together does make a difference, as is being seen in Cornwall, for example. Commitment to delivery of a good bus product can succeed in growing bus use anywhere in England.
Policy recommendations
To increase bus use, there needs to be continued appeal to the current user base, alongside strategies to attract new users, particularly car drivers who could switch to the bus. The key variables which will define that choice are (compared to driving):
- journey time and reliability
- relative cost
- quality of the door to door experience.
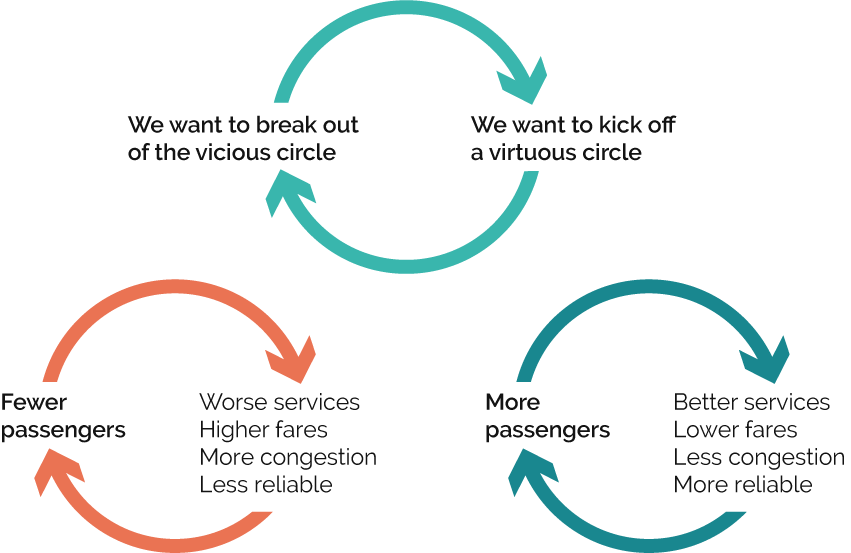
Outside of London all services are provided in a deregulated market by private operators. Decisions on fares, routes and frequencies are out of the hands of local government, with the exception of the small proportion of tendered, socially necessary services. However, it is the relative cost and the comparative journey time experience that matters. The joint goal of councils and bus operators needs to be to create a virtuous circle of rising patronage and service levels with lower fares which then supports further investment.
Partnership working for growing bus use is best done through a bus strategy and delivered through a bus quality partnership. The Bus Services Act 2017 [5] provides for local transport authorities to develop enhanced partnerships with bus operators, with agreements covering a wider range of matters including fares.
The Act also gives elected Mayors of Combined Authorities the power to re- regulate the bus system in their areas, subject to a specified process. Other local transport authorities can also institute a process to re-regulate if partnership approaches have failed. However, where there is no elected Mayor then re-regulation is subject to the Secretary of State’s agreement.
The realities of coronavirus for the industry are that partnership working will now become even more important. There are arguments for different regulatory models to now be tried in different areas [6]. There is no “one-size fits all” solution.
This note is about what the evidence shows on what works and does not make prescriptive statements about the best model under which it should be delivered.
Area for action 1: Service reliability
In 2018, in England outside London, 83.1 per cent of lower frequency bus services ran punctually (within 5 minutes of schedule) [7]. Punctuality and frequency of service are key factors that instill confidence in users regarding reliable transport.
On time performance, comprehensive route networks and frequent coordinated services are two key recommendations put forth by Transport for Quality of Life in respect to building strong bus services and patronage [8].
Transport Focus’s 2019 Bus Passenger Survey shows that punctuality and reliability tend to be more highly valued by fare- paying passengers, younger people, and people using the bus for commuting to work: precisely the kind of new users that need to be attracted to bus travel [9].
Factors affecting bus reliability and punctuality that are within the bus operator’s control include having enough vehicles and drivers to operate the advertised service, setting off on time, and making sure passengers can board as quickly as possible whilst safeguarding passenger safety and comfort.
Factors outside the bus operator’s control include predictable traffic congestion (due to sheer weight of traffic and planned roadworks) and unpredictable traffic congestion (for example due to road traffic accidents and adverse weather).
Transport Focus’s bus passenger survey shows that the three most common causes of bus delays are: traffic congestion, slow passenger boarding, and roadworks [10].
The widespread roll out of contactless card payment and bus passes on smartcard has the potential to speed up boarding times.
Local highway authorities can take steps to reduce the impact of traffic congestion on bus reliability by measures including bus priority measures (bus lanes, priority measures at traffic signalled junctions, and so on) and by improving information to bus operators about planned roadworks or road closures, major events and the real-time management of incidents, so that they can respond in good time, e.g. by putting route diversions into place.
Ideally, buses perform best when they are insulated from general traffic congestion altogether. This can be done through traffic regulation orders to designate bus-only streets, bus gates to exclude through traffic in town centres, or by providing exclusive busways or guided busways. Busway schemes have been successful in Cambridgeshire [11], Luton [12], Gateshead and on the Leigh-Manchester corridor [13].
During the low-traffic period of the coronavirus lockdown, bus companies have been able to run their services with a 12.5 per cent lower operating cost than usual due to the smoother running along the routes [14]. If maintained, this would allow companies to revise timetables with new, faster journey times, and either lower the costs of running the service to passengers or permit a more frequent service to be operated with the same number of buses.
Area for action 2: Relative cost of public transport
Public transport use is very sensitive to the price of fares, and to the relative cost of driving versus using the bus [15]. The RAC Foundation’s cost of travel index shows that bus and coach fares have risen by an average of 55 per cent since 2010. In the same period, the total cost of motoring rose by less than 20 per cent – less than the overall average cost of living, which has risen by 30 per cent [16].
Reducing bus fares is possible and financially sustainable if patronage growth and an increase in average loading per bus can be achieved. Agreements over fares can form part of enhanced bus partnerships under the provisions of the Bus Services Act 2017 [17].
To kickstart the virtuous circle of patronage growth that makes lower bus fares viable, the relative cost of car use also needs to be considered. At present, outside the central London congestion charge zone, car users do not pay directly for the costs the traffic congestion they cause impose on other road users, including bus users.
Meanwhile, as car users switch from petrol / diesel to battery electric power, fewer will be paying any motoring taxes on a per mile basis, because they will not be paying fuel duty. This offers scope to councils to explore strategies for charging for parking and congestion.
- Cornwall Council is trialling a four-year pilot scheme for reducing bus fares as part of a wider package of improvements in its One Public Transport System for Cornwall project [18].
- Brighton & Hove: the bus company reduced the price of short hop single fares from £2.20 to £1.90 in January 2020. The bus company acknowledges that one of the barriers to using public transport is a lack of knowledge regarding fares and is considering a radically simpler £1 flat fare [19].
- Transport for London’s £1.50 hopper fare permits one hour’s worth of bus travel on any number of buses, allowing people to make a journey that requires a change of route to complete without being financially penalised.
- A study of bus fare integration in Haifa, Israel, found a 30 per cent increase in number of bus trips being made and evidence of modal shift from the car to the bus [20].
Area for action 3: Passenger experience
Recent research shows that the decline in bus use is due to a fall in the proportion of the population who are using the bus; not existing bus users making fewer trips [21]. This highlights the importance of making changes to attract people who do not use the bus, or have stopped doing so.
Improving the passenger experience through soft factors such as cleanliness inside the bus, mobile charging points, and bus stop infrastructure are all ways of attracting potential users and retaining existing passengers. When implemented as a package of improved bus services (including affordability, reliability), soft variables such as comfort, security and cleanliness can help improve patronage by 5 to 10 per cent [22].
Adopting a ‘whole journey approach’, in which operators and authorities work together to ensure that every stage of the passenger’s journey by bus, including reliable information and good quality bus stop provision, as well as welcoming and comfortable vehicles, can have a tangible impact on transport decision- making and whether to travel by bus [23].
Personalised travel planning and travel awareness schemes demonstrate a commitment to passengers and their travel experience [24] and is an opportunity for councils and service providers to work together.
As part of their Greater Bristol Bus Network, Bristol City Council worked with local bus operators to enhance the passenger experience by improving 1,000 bus stops, procuring 120 new buses and undertaking public realm improvements such as tree plantings along bus shelters [25].
When public transport was coordinated by the West Midlands Passengers Transport Executive (Centro), it was recognised for providing passengers with high quality information that was well-integrated across providers and modes [26].
Plymotion is a scheme run by Plymouth City Council to promote active travel and public transport through direct citizen engagement. By working directly with workplaces and job seekers, Plymouth has seen a 22 per cent increase in bus use among these target groups [27].
Conclusion
Thinking short, medium, and long term
The coronavirus lockdown and the need for social distancing on buses destroyed the commercial funding model for bus services. At present, bus services are completely dependent on emergency government funding support, much of which is paid through councils.
It is likely to be some time before a commercial model for operating bus services can return. However, the emergency has also shown that essential workers need the bus to get to work and places cannot function without a bus service. Getting by without a bus service is simply not an option.
This briefing note shows that the bus needs to play a bigger role in the future if we are to make rapid progress on decarbonisation. This will require a concerted effort to rebuild confidence in bus services in the medium term and to address the shortcomings of service provision.
Whilst different forms of public-private management of the bus system could emerge after coronavirus, the critical issue is whether the right conditions will be created for the bus.
This means addressing every aspect of the journey from access to bus stops to the quality of the vehicles. It means providing road space for bus priority to deliver faster journey times. It means ensuring that pricing for cars and buses makes bus use the more attractive option.
However, this is managed, it requires more support for the bus than has been delivered in the past two decades.
There are some great examples of routes, companies, and areas where bus growth has been delivered in difficult conditions. There are opportunities for everywhere to do better on the bus, and there are good short and long-term reasons to do so.
Notes
This briefing is part of a series written for the Local Government AssociationOpens in a new tab (LGA), and was first published on their website.
DecarboN8 has received funding from UK Research and Innovation under grant agreement EP/S032002/1.
Figure 1: Cars with an average occupancy rate of 1.6 people emits 159 grams of carbon dioxide per person per km. A partially full bus carrying 12.2 passengers emits 105 grams of carbon dioxide per person per km, whereas a bus with an average occupancy of 24 people emits only 53 grams of carbon dioxide per person per km.
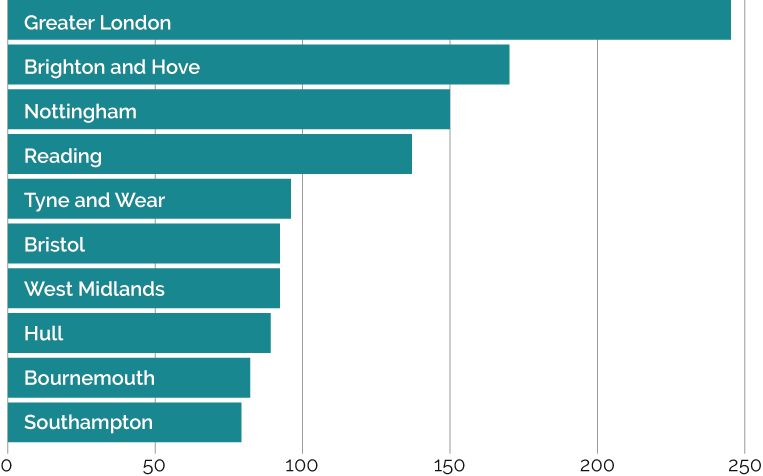
Figure 2: The highest bus use in 2018 by LTA was in Greater London, with an average of 248 bus trips per person per year. In Brighton and Hove it was 170, Nottingham 150, Reading 132, Tyne and Wear 98, Bristol 92, West Midlands 96, Hull 92, Bournemouth 85 and Southampton 78.
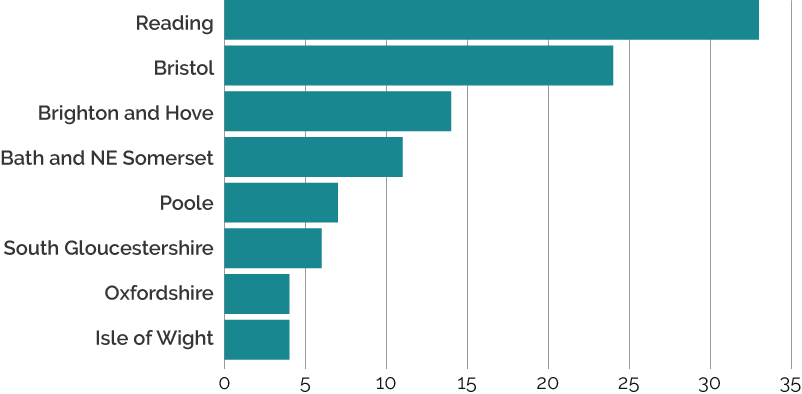
Figure 3: In 2010 to 2018, the growth in bus use was highest in Reading, at an increase of 33 bus trips per person per year. Next was Bristol at 29, Brighton and Hove 14, Bath and NE Somerset 11, Poole 7, South Gloucestershire 6, Oxfordshire 4 and the Isle of Wight 4.
Figure 4: We want to break out of the bus vicious circle, we want to kick off a virtuous circle: fewer passengers lead to worse services, higher fares, more congestion and lower reliability, while more passengers lead to better services, lower fares, less congestion and more reliable services.
References
- Brand, C., Anable, J. and Morton, C. (2018). Lifestyle, Efficiency and Limits: Modelling transport energy and emissions using a socio-technical approach. Energy Efficiency, 12: 187–207. doi: 10.1007/s12053-018-9678-9Opens in a new tab
- DecarboN8 (2020). Technical note: carbon emissions by vehicle type & occupancy table, pdfOpens in a new tab (2 pages, 119 KB).
- DfT (2019). Annual bus statistics: England 2018/19, pdfOpens in a new tab (18 pages, 3.9 MB).
- Le Vine, S and White, (2020). The shape of changing bus demand in England, pdfOpens in a new tab (88 pages, 2.8 MB). Independent Transport Commission.
- National Archives (2017). Bus Services Act 2017Opens in a new tab
- Campaign for Better Transport (2020). Covid-19 Recovery: Renewing the Transport SystemOpens in a new tab
- DfT (2019). Annual bus statistics: England 2018/19, pdfOpens in a new tab (18 pages, 3.9 MB).
- Transport for Quality of Life (2016). Building a World-Class Bus System for BritainOpens in a new tab
- Transport Focus (2019). Bus Passenger Survey. Autumn 2019 Report, pdfOpens in a new tab (180 pages, 33.1 MB).
- Transport Focus (2019). Bus Passenger Survey. Autumn 2019 Report, pdfOpens in a new tab (180 pages, 33.1 MB).
- Cambridgeshire BuswayOpens in a new tab
- Central Bedfordshire Travel ChoicesOpens in a new tab
- Transport for Greater Manchester (2019). Leigh/Atherton-Manchester BuswayOpens in a new tab
- First Bus (2020). Personal Communication.
- Currie and Wallis (2008). Effective ways to grow urban bus markets. Journal of Transport Geography, 16: 419-429.
- RAC Foundation (2020). Transport Price IndexOpens in a new tab
- National Archives (2017). Bus Services Act 2017Opens in a new tab
- cornwall.gov.uk. One public transport system for Cornwall (OPTSfC)Opens in a new tab
- The Argus (2020). £1 flat fare on the busesOpens in a new tab Published online 3 June.
- Sharby, N and Shiftan, (2012). The impact of fare integration on travel behavior and transit ridership. Transport Policy, 21: 63-70.
- Le Vine, S and White, (2020). The shape of changing bus demand in EnglandOpens in a new tab Independent Transport Commission.
- Currie and Wallis (2008). Effective ways to grow urban bus markets. Journal of Transport Geography, 16: 419-429.
- Carreira et al (2014). Understanding the travel experience and its impact on attitudes, emotions and loyalty towards the transportation provider – A qualitative study with mid- distance bus trips. Transport Policy, 31: 35-46.
- Cairns, S. et al (2004). Smarter Choices: Changing the way we travel. Chapter 6: Public transport information and marketingOpens in a new tab London.
- Bristol Council (2015). The Bristol Method: How to increase public transport use, pdfOpens in a new tab (22 pages, 2.3 MB).
- Preston, J. (2010). What’s so funny about peace, love and transport integration? Research in Transportation Economics, 29: 329-338.
- Arup (2020). You’ve declared a climate emergency. Next steps: TransportOpens in a new tab
Publication details
Walker, R., Campbell, M., Marsden, G., Anable, J., McCulloch, S. and Jenkinson, K. (2020). Decarbonisation transport: the role of busesOpens in a new tab Local Government Association: London. Open access
Banner photo credit: Alireza Attari on Unsplash