
Donal Brown, Christian Jaccarini, Timothy J Foxon, Giulia Mininni, Claire Copeland, Marie Claire Brisbois, Siobhan Stack-Maddox, Beatriz Aguirre Martinez and Max Lacey-Barnacle
On this page:
- Foreword
- Executive summary
- 1. Context
- 2. Achieving net-zero: local goals, local delivery
- 3. What are Local Green New Deals?
- 4. Putting regions centre stage: Greater Brighton & North of Tyne
- 5. Citizen engagement: do local people want a Green New Deal?
- 6. Delivering Local Green New Deals
- 7. Ensuring economic and social justice in Local Green New Deals
- 8. Conclusions
Foreword
It’s a challenging time to be working on the climate and nature emergency. While droughts, heatwaves and floods escalate around the world, the UK government doubles down on its plans for new fossil fuel production. As people call in increasing numbers for clean air, affordable energy and a liveable future, the Prime Minister tells us that the ‘proportionate’ thing to do is to slow down climate action.
Yet, despite the lack of leadership from central government, some local authorities and regional leaders have been stepping up and offering a glimpse of what is possible – as this report so powerfully demonstrates. From Greater Brighton to North of Tyne, it’s exciting to see the potential and the appetite for local Green New Deals.
One of the most striking revelations in this report is the overwhelming popularity of the policies that were put to residents. This reinforces what Green New Deal advocates have been saying for years: if we design it right, climate action is win-win. Local Green New Deals will create jobs, deliver warmer homes and lower energy bills, and make our neighbourhoods more pleasant places to be.
So what does getting the design right look like? Fairness was a key theme raised by research participants, who were particularly concerned about the availability and quality of jobs. A true Green New Deal has social justice at its heart, as well as cutting carbon, so it’s essential that local Green New Deals retain wealth in the local economy and prioritise public services like buses and childcare.
It’s notable for a report on local action that virtually all the recommendations here are for central government. This speaks to the extraordinarily centralised nature of power in the UK, and the need to devolve powers and resources to local authorities so that they can get on with the job.
In my role as co-chair of the All-Party Parliamentary Group on the Green New Deal, I have heard from local government and community leaders doing all kinds of inspiring work to help people and nature to thrive. Again and again, we hear that local areas know what needs to be done – but a lack of resources and lack of support from central government is holding them back. That urgently needs to change.
I thank the New Economics Foundation and the Centre for Research into Energy Demand Solutions for this important contribution to public discussion of the Green New Deal. I look forward to raising its recommendations in Parliament as I and my cross-party colleagues continue our efforts to make the Green New Deal a reality at every level of government.
Caroline Lucas, Member of Parliament for Brighton Pavilion
Executive summary
In this report, we outline a transformative plan for how local and regional action could help to achieve the UK’s net-zero climate goals, whilst providing economic, social and environmental benefits to citizens – Local Green New Deals. The report argues that local and combined authorities should be given new powers and funding, and create new institutions to deliver measures that would help to reduce energy usage (or demand). It also provides evidence that these measures would be viewed favourably by the majority of citizens. We focus on two contrasting regions, Greater Brighton and North of Tyne – both having recently put forward progressive programmes for local environmental and social action, but with very different local governance arrangements.
What are Local Green New Deals?
We build on research from the Centre for Research into Energy Demand Solutions (CREDS) showing how the UK could meet net-zero via measures that reduce energy use by 50% or more by 2050, whilst maintaining or enhancing citizens’ quality of life. Presenting new empirical research examining citizen preferences in two UK regional case studies, the report demonstrates high levels of public support for measures to address climate and economic challenges, while delivering social, economic, and environmental justice. When considering areas of policy that could be delegated locally, we argue four key objectives should be a major focus for developing Local Green New Deals:
- Cheaper, warmer, zero carbon homes: area-based retrofit programmes should ensure all homes meet a decent standard of energy efficiency, with funding for low-income households and local one-stop shops to support delivery in each neighbourhood. Support for the adoption of low-carbon heating technologies should also be greatly expanded.
- Affordable, sustainable public transport: access to public transport must be greatly improved to support a reduction in car use. This will require the expansion of bus routes, new light rail and train services and the electrification of these systems. Moreover, the current expensive, fragmented, and privatised model of public transport provision is unlikely to be compatible with these aims.
- Car-free city centres and active travel: urban centres which are free of traffic, pollution and noise are better and safer places. Alongside expanded public transport provision, car-free zones, extensive active travel routes and walkable towns and cities are key components of improving local health and wellbeing while meeting net-zero goals.
- Expanding green spaces and nature restoration: nature-based solutions are a critical means of sequestering carbon and addressing wider environmental issues such as air pollution. Additionally, by greatly expanding wild spaces, citizens can enjoy the benefits of spending time in nature and restore the UK’s depleted biodiversity.
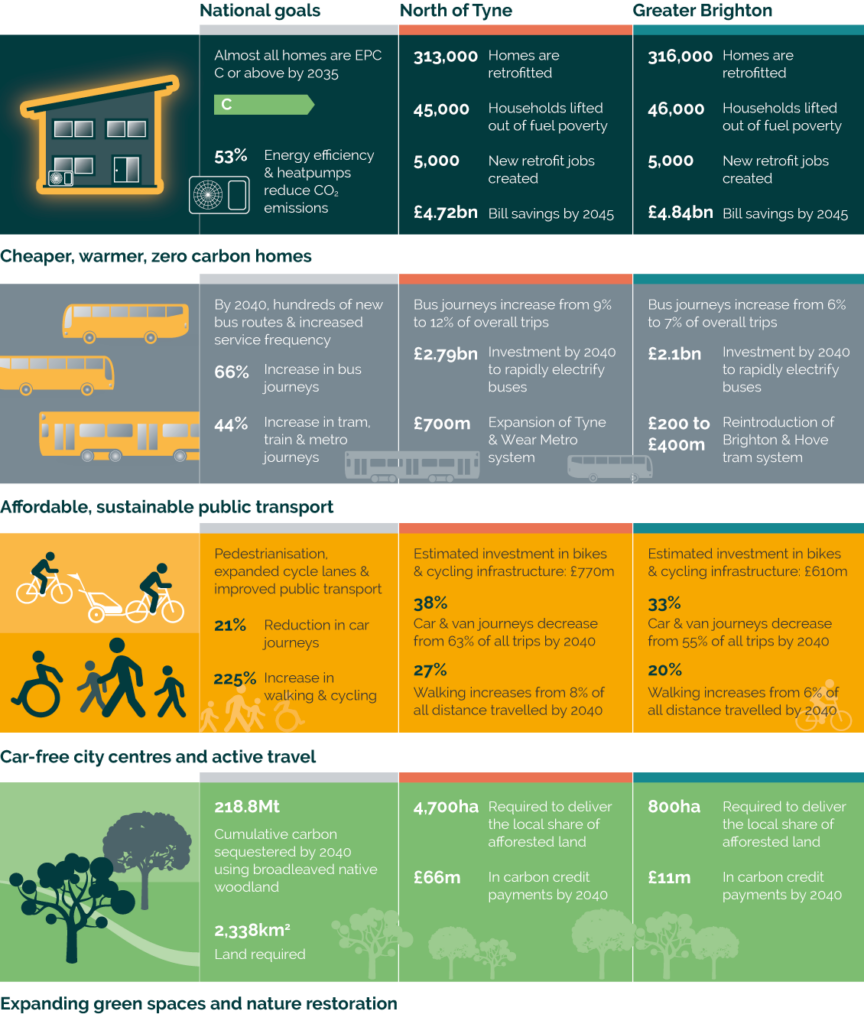
Figure image description
- Cheaper, warmer, zero carbon homes – National goals: Almost all homes are EPC C or above by 2035; Energy efficiency and heat pumps reduce CO2 emissions by 53%; North of Tyne: 313,000 homes are retrofitted, 45,000 households are lifted out of fuel poverty, 5,000 new retrofit jobs are created, combined all leading to bill savings of £4.72bn by 2045; Greater Brighton: 316,000 homes are retrofitted, 46,000 households are lifted out of fuel poverty, 5,000 new retrofit jobs are created, combined all leading to bill savings of £4.84bn by 2045.
- Affordable, sustainable public transport – National goals: By 2040, hundreds of new bus routes and increased service frequency, 66& increase in bus journeys, 44% increase in tram, train & metro journeys; North of Tyne: bus journeys increase from 9% to 12% of of overall trips, £2.79bn invested by 2040 to rapidly electrify buses, £700m expansion of Tyne & Wear Metro system; Greater Brighton: bus journeys increase from 6% to 7% of of overall trips, £2.1bn invested by 2040 to rapidly electrify buses, £200 to 400m to reintroduce the Brighton & Hove tram system.
- Car-free city centres and active travel – National goals: pedestrianisation, expanded cycle lanes & improved public transport, 21% reduction in car journeys, 225% increase in walking & cycling; North of Tyne: Estimated investment in bikes & cycling infrastructure £770m, car & van journeys decrease from 63% of all trips to 38% by 2040, walking increases from 8% of all distance travelled to 27% by 2040; Greater Brighton: Estimated investment in bikes & cycling infrastructure £610m, car & van journeys decrease from 55% of all trips to 33% by 2040, walking increases from 6% of all distance travelled to 20% by 2040.
- Expanding green spaces and nature restoration – National goals: Cumulative carbon sequestered by 2040 using broadleaved native woodland 218.8Mt, 2,338 square km land required; North of Tyne: 4,700ha of land required to deliver the local share of afforested land, £66 m in carbon credit payments by 2040; Greater Brighton: 800ha of land required to deliver the local share of afforested land, £11 m in carbon credit payments by 2040.
These measures are popular with citizens
Local Green New Deals should involve citizens in the decision-making process for introducing these measures. We undertook citizen engagement in both the North of Tyne and Greater Brighton regions. Firstly, in surveys, over 600 people were asked to assess their approval of 14 climate mitigation options, and choose their top 3 measures, in relation to a set of 20 wellbeing indicators. Survey responses in both regions were very similar, with affordable public transport, sustainable construction materials and home energy efficiency being the most popular measures. Plant-based diets, car-free zones and car sharing were less popular, though still largely viewed favourably. In both areas, respondents preferred increased central government funding for local government, above council tax increases. The novel option of funding these options via municipal climate bonds was as popular as the UK government’s current competitive bidding approach.
Secondly, we carried out focus groups with 25 participants in each location to examine 6 policy areas in more detail: home energy efficiency; affordable public transport; active travel; car-free zones; nature-based solutions; and plant-based diets. This provided quantitative findings from participants, using a detailed Multicriteria Mapping (MCM) methodology, as well as qualitative insights from group discussions. In Brighton, affordable public transport, nature-based solutions, and active travel received the highest scores, with the average score for all 6 options higher than 50 out of 100, but with considerable variation between participants. In North of Tyne, most options had a higher average positive approval score, except for subsidised plant-based diets. While the presented options were generally viewed favourably, how they are implemented mattered to the participants. Critical themes which emerged from the discussions were: 1) fairness, including distribution and access; 2) affordability and reliability of services; 3) physical and mental health; and 4) environmental protection.
Delivering Local Green New Deals
Building on the findings from the citizen engagement exercises and previous analysis of low energy demand pathways, we analyse the scale of action needed in these four policy areas for the two regions, and develop Local Green New Deal policy proposals to achieve this. We outline a series of recommendations for an increased role for local government across three domains: 1) New institutions for delivery, 2) New powers, and 3) New funding.
We propose that a Local Green New Deal for a UK region should consist of the following:
Cheaper, warmer, lower carbon homes:
A national retrofit programme would see almost all homes meet EPC ‘C’ standard or above by 2035, with the deployment of energy efficiency improvements including heat pumps delivering a 53% reduction in home CO2 emissions. In both North of Tyne and Greater Brighton, this would see over 310,000 homes retrofitted, requiring around £2.9bn of public and private capital investment. Due to the much higher prevalence of low-income households in North of Tyne, the level of public investment needed is much higher (£1.04bn) than in Greater Brighton (£286m). In each location, delivering on this ambition creates over 5,200 construction jobs, and by 2045 leads to over £4.7bn in energy bill reductions – saving the average household £779 a year and lifting over 45,000 households out of fuel poverty.
New institutions for delivery:
- A 10-year Local Retrofit Delivery Framework supporting regions to set up a Retrofit Taskforce and local one-stop shops, with central government expertise and leadership to support implementation.
- A nationwide citizen engagement campaign, supporting councils and community groups to engage the public with the retrofit challenge.
- Establish new training courses and apprenticeships for retrofit tradespeople, costing £400m nationwide.
New powers:
- Most retrofit and fuel poverty programme delivery to be devolved to local and combined authorities.
- Reintroduce Minimum Energy Efficiency Standards (MEES) and strengthen enforcement powers.
- Amend legislation to allow for the introduction of Property-Linked Finance, so that the UK can fully leverage private investment.
New funding (UK wide):
- UK government devolves £2bn to the Local Retrofit Delivery Framework.
- UK government devolves £48.5bn low-income building fabric grants with £9bn available for a heat pump boiler scrappage programme, and £4.5bn ringfenced for low- income households.
- Develop a blended financing offer, combining grants and low-interest loans, based on household income, with repayments tied to the property not the individual.
Affordable, sustainable public transport:
By 2040, thousands of new bus routes are developed and the frequency of existing services increases, with bus journeys increasing by 66%. A 44% increase in tram, train, and metro journeys is achieved, and buses are rapidly electrified. This requires £2.79bn investment in North of Tyne and £2.1bn in Greater Brighton by 2040. Buses’ relative composition of all journeys grows from 9% to 12% in North of Tyne and 6% to 7% in Greater Brighton.
Further specific investments would be a significant £700m expansion of the Tyne and Wear Metro system, and the reintroduction of a tram system in Brighton and Hove at a cost of between £200-400m, based on systems in similar UK cities.
New institutions for delivery:
- Establish central advisory bodies with expertise on bus and rapid transit.
- Review the functional geography of transport authorities.
- Integrate rail planning with local and regional transport planning.
- Local governments establish wholly owned arm’s length development companies.
New powers:
- Give control over buses to all transport authorities.
- Lift the ban on municipal ownership of bus operators.
- Move towards a not-for-profit system of bus services.
- Devolve the powers for setting up a light rail system to local government and establish trailblazer cities for integrated public transport.
New funding (UK wide):
- Invest around £37bn nationwide to expand and decarbonise bus services and £7bn in local rail by 2040.
- Give local areas the ability to tax large local employers for rail infrastructure, following London and the Crossrail example.
- Strengthen current mechanisms for capturing land value uplift, and reform the land development process to deliver increased revenues for councils.
- Reform appraisal tools for large capital projects, to better value environmental and social benefits.
Car-free city centres and active travel:
City centres are pedestrianised, cycle lanes are greatly expanded, and high streets are favoured above out-of-town shopping. When combined with improved public transport, this leads to a 21% reduction in car journeys and a 225% increase in walking and cycling. By 2040, car and van journeys decrease from 63% of all journeys in 2022 to only 38% in North of Tyne, and from 55% to just 33% in Greater Brighton. These changes enable walking to increase dramatically from 8% of all distance travelled to 27% by 2040 in North of Tyne, and from 6% to 20% in Greater Brighton. Cycling also increases from just 2% of distance travelled to 6% in both regions, requiring substantial investment, with an estimated £770m invested in bicycles and cycling infrastructure in North of Tyne and £610m in Greater Brighton.
New institutions for delivery:
- Central government lays out a clear vision for low-traffic town and city centres.
- National Highways are required to work with local government to tackle emissions.
- Empower and fund local development corporations to develop transport-led housing.
New powers:
- Low-Traffic Neighbourhoods are made less difficult and expensive to implement.
- Strengthen local government tools to promote safer cycling.
New funding (UK wide):
- Review and reform taxes and charges on roads and parking.
- Devolve and pool local authority transport funding to provide longer term certainty.
- Radically reform appraisal tools for large capital projects, to properly capture the benefits of active travel and public transport.
Expanding green spaces and nature restoration:
To deliver improvements in access to nature and biodiversity, nature-based solutions are promoted in preference to bioenergy power plants with carbon capture and storage (BECCS). By 2040, a cumulative 219 Mt of carbon is sequestered nationally using reforestation and new wild spaces, covering 233,800 hectares (Ha) or around 0.96% of the UK’s land area. Delivering North of Tyne’s share of afforested land would require a total of 4,709 Ha of reforested area, with the vast majority in Northumberland. Using carbon credit payments, this would cost around £66m by 2040. Greater Brighton’s smaller suitable landmass means its share of this afforestation programme is much smaller – a total of 807 Ha. Using carbon credit payments, this would cost around £11.3m by 2040.
New institutions for delivery:
- Create a national Land Use Framework that amends property rights such that landowners must comply with agreed uses for agricultural and rural land.
- Explore establishing a Bank of England-funded land bank to support landowners struggling to make changes to their land.
- Reform UK food systems to empower farmers to take better care of their land.
- Make the Land Register free to access for all.
New powers:
- Empower local government to create Local Nature Recovery and Local Land Use Planning Strategies, and to designate areas as part of a Nature Recovery Network.
- Assign new powers to National Park Authorities to drive nature recovery.
- Give the Forestry Commission a new statutory duty to promote nature recovery and support net-zero.
New funding (UK wide):
- Shift agricultural subsidies to reward farmers for increasing biodiversity and carbon sequestration.
1. Context
The UK is attempting to address the climate emergency in the face of rising inequality and stagnant economic growth. Whilst this requires significant investment in innovation and the deployment of renewables, it also requires measures which reduce energy demand and deliver social and economic benefits. Most of these demand reducing measures need to be locally devised and delivered. This report examines the potential for the implementation of these measures at a local and regional level, building on CREDS research showing how the UK could meet net-zero greenhouse gas emissions (Barrett et al, 2021). Presenting new findings from engagement with citizens in two UK regions – Greater Brighton and North of Tyne – the report demonstrates high levels of public support for ‘Local Green New Deals’ (New Economics Foundation, 2023) to address climate and economic challenges. Developed in partnership with the New Economics Foundation (NEF), the report makes policy proposals for how Local Green New Deals could deliver the social, economic, and environmental transformation needed to achieve net-zero. This will require local and regional combined authorities to be given the appropriate powers, funding and supporting institutions, alongside public engagement to ensure fairness and affordability. Drawing on the two contrasting regions of the North of Tyne and Greater Brighton, this report sets out a template for how Local Green New Deals could be achieved.
The four pillars of a Local Green New Deals framework that we explore are:
- Cheaper, warmer, zero carbon homes
- Affordable, sustainable public transport
- Car-free city centres and active travel
- Expanding green spaces and nature restoration
In Section 2, we introduce Green New Deals and the need for local delivery to meet climate emergency goals. In Section 3, we outline how achieving locally conceived and democratically delivered Green New Deals can help to reach these goals by reducing energy demand whilst maintaining or enhancing citizens’ quality of life. Section 4 introduces the reasons why our two case study regions, Greater Brighton and North of Tyne, are of particular interest. Section 5 summarises our primary research with the citizens of the North of Tyne and Greater Brighton, which demonstrates the popularity of Green New Deal measures across the demographic spectrum, whilst highlighting issues to be addressed in their implementation. Section 6 then outlines our detailed policy proposals across four key areas of policy: cheaper, warmer, zero carbon homes; affordable, sustainable public transport; car-free city centres and active travel; and expanding green spaces and nature restoration, providing a series of policy recommendations on how national government can support local and regional government in this agenda. Section 7 discusses how to ensure economic and social justice in Local Green New Deals. Section 8 provides summary conclusions.
2. Achieving net-zero: local goals, local delivery
The UK, Scottish and Welsh parliaments and multiple local and regional authorities have all voted to declare a ‘Climate Emergency’. This follows a global movement that emerged from social pressure and discontent with the lack of climate action within governments, industries, and businesses.
In a recent appraisal of the UK’s progress towards reaching its net-zero target, the Climate Change Committee finds that more than half of the emissions reduction needed must now come from citizens adopting low-carbon technologies and lifestyles (CCC, 2021). They further note that 30% of reductions depend on actions that involve local authorities, and that they have a significant degree of influence over other potential reductions. Increasingly, climate action is focusing more on regional and local scales and is taking a more ‘place-based’ approach. A recent appraisal of the economic costs of net-zero across six city regions (Innovate UK, 2022) found that place-based delivery requires only 25% of the investment of a ‘place-agnostic’ approach, and creates about twice the level of energy cost savings and social benefits.
While the net-zero role of local and regional authorities is considered critical, powers to make policy decisions remains largely centralised, and austerity measures have reduced authorities’ capability and capacity to implement climate actions (Tingey and Webb, 2020). Nevertheless, local and regional authorities are developing innovative ways to use local investment projects, initiatives, and procurement frameworks to meet multiple objectives, including decarbonisation, providing quality jobs, reducing fuel poverty, and improving local wellbeing and economic competitiveness. Performance is, however, uneven, and this is resulting in rising inequality within and between locations (Gray and Barford, 2018). To overcome this, we propose Local Green New Deals as an overarching framework for achieving these aims.
The Green New Deal
Originally conceived by a group of UK economists and policy experts in the context of the climate emergency and 2008 financial crisis (Simms et al, 2008), the Green New Deal gained prominence via a group of progressive US politicians in 2019 (Senate of the United States, 2018). The idea of local action to promote a Green New Deal in the UK has recently been championed by an All-Party Parliamentary Group of MPs and Peers (The Green New Deal Group, n.d.). Work by the authors of this report (Brown et al, 2023) has identified five core elements of a UK Green New Deal:
- Financial reforms;
- Green infrastructure investment;
- Financing the green new deal;
- Ownership structures;
- Economic, social and climate justice
The research notes that while some elements of the Green New Deal require national and international action, much of the implementation will be local in nature. Indeed, this drive for locally coordinated and delivered solutions is already being taken up by several local and regional authorities. For example, in 2021, the North of Tyne Combined Authority established a ground-breaking £18m Green New Deal investment fund (North Tyne Combined Authority, 2021a) to tackle carbon emissions whilst delivering inclusive economic growth. In 2023, Brighton and Hove City Council set out plans for a Green New Deal, proposing a £3.9m investment in public transport, an insulation programme, developing the circular economy, and massive investment in renewable energy across the region. These ideas are also supported by the Greater Brighton City Economic Board, which covers seven local authority areas, from Bognor in the west to Seaford in the east, and Crawley in the north of Sussex. Both plans emphasise that tackling the climate crisis is also the key to tackling the economic crisis.
However, local plans to move further and faster than the UK government in tackling the social, economic, and environmental crises are hampered by the UK’s overly centralised political system. Indeed, with few powers to enact transformative changes, the UK, and especially the English governance landscape, is among the most centralised in the developed world. By centralising powers in Westminster, the UK’s regions are being held back on their pathway to a low-carbon future which delivers economic and social prosperity. Despite 75% of District, County, Single-Tier Councils and Combined Authorities having declared a Climate Emergency (Gudde et al, 2021) (as of November 2021), few have the control over their public transport systems and the powers and resources needed to retrofit their housing stock or engage in nature restoration on the scale that climate change targets tell us is necessary.
In this report, we set out a plan for how policymakers could redress this imbalance through Local Green New Deals – empowering local areas to capitalise on the huge potential of a low-energy, low-carbon future.
3. What are Local Green New Deals?
Place-based design and delivery of net-zero measures is likely to lead to improved economic outcomes. In addition to the economic case, recent CREDS research on ‘Positive Low-Energy Futures’ (PLEF) (Barrett et al, 2022) has shown that energy demand reduction and transformation is critical for realising national net-zero emissions targets and has multiple societal and environmental benefits. This work showed that an aspirational ‘Transform’ scenario, consisting of a range of transformative measures to reduce energy demand, including significant improvements to the energy efficiency of housing and building stock, reduced car use and increased walking and cycling, could lead to a 52% reduction in final energy consumption by 2050, compared to 2020 levels. It argued that these measures could be implemented whilst maintaining or enhancing citizens’ quality of life by realising strong ‘co-benefits’, including healthier active lifestyles, lower airborne pollution, and an improved work-life balance. Moreover, many of these ‘demand-side’ actions tend to be implemented at a local government level.
When considering the areas of policy that are most appropriate to be delegated locally, we argue four key objectives should be a major focus for developing Local Green New Deals, as shown in Figure 1.
In this report, we adopt the ambitious targets from the PLEF ‘Transform’ scenario to inform the detailed policy proposals for Local Green New Deals across these four areas. In addition, we draw on other recent CREDS-supported research on a national home retrofit programme, Cheaper Bills, Warmer Homes, and the CREDS Place-Based Carbon Calculator (PBCC) (PBCC, 2022).

Figure 1 image text
- Cheaper, warmer, zero carbon homes: Area-based retrofit programmes should ensure all homes meet a decent standard of energy efficiency, with funding for low-income households and local one-stop shops to support delivery in each neighbourhood. Support for the adoption of low-carbon heating should also be greatly expanded.
- Affordable, sustainable public transport: Access to public transport must be greatly improved if car use is to be reduced. This will require expansion of bus routes, new light rail and train services and the electrification of these systems. Moreover, the current expensive, fragmented, and privatised model of public transport provision is unlikely to be fit for these aims.
- Car-free city centres and active travel: Urban centres free of traffic, pollution and noise are better and safer places to be. Alongside expanded public transport provision, car-free zones, extensive active travel routes and walkable towns and cities are key components of improving health and wellbeing while meeting net-zero ambitions.
- Expanding green spaces and nature restoration: Nature-based solutions are a critical means of sequestering carbon and addressing wider environmental issues and air pollution. Moreover, by greatly expanding wild places, citizens can enjoy the benefits of spending time in nature and restore the UK’s depleted biodiversity.
4. Putting regions centre stage: Greater Brighton & North of Tyne
With steps towards English devolution, local and regional governments have become an increasing focus as an appropriate scale and geography to coordinate and deliver key elements of the net-zero transition. However, the changes to this governance landscape have not been even. While some regions, such as North of Tyne, have a Combined Authority with an elected Mayor and increased statutory powers, others, such as Greater Brighton, have only informal structures and few integrated powers. In examining Local Green New Deals, we explore these two contrasting regions – both having recently put forward progressive programmes for local environmental and social action. Below, we provide a summary of these proposals and briefly highlight the two regions’ economic, demographic and governance characteristics.
Greater Brighton
Brighton and Hove is on the southeast coast of England and has a population of over 270,000. The city is well known for its flourishing economy, its diversity and as a centre for innovation and enterprise (Brighton & Hove City Council, 2018). Brighton & Hove City Council (BHCC) is also known for its commitment to, and engagement with, sustainability. The Council declared a climate emergency in 2018, and through democratic consultations with their Climate and Youth Assemblies in 2020, developed a Carbon Neutral 2030 Programme. Its aim is to address poverty and inequality, and climate change, energy and decarbonisation initiatives. In 2020, BHCC also unanimously endorsed a motion to support a Green New Deal.
Greater Brighton comprises seven councils: Adur, Arun, Brighton and Hove, Crawley, Lewes, Mid Sussex and Worthing, with around 1 million inhabitants. Greater Brighton’s economy paints a contrasting picture between a growing qualified and prosperous core in Brighton & Hove and a less prosperous population in the periphery, with Brighton & Hove itself being one of the UK’s most unequal cities. Unaffordable housing, a relatively unskilled workforce, high youth unemployment rates, and infrastructural challenges, such as the road and rail networks, are currently hampering the region’s progress (Regeneris, 2018).

Formed in 2014, the Greater Brighton Economic Board (GBEB) is a critical player in promoting sustainability and tackling climate change. The Board is a legally constituted body overseeing the area’s economic growth and related activities. GBEB organised a Climate Summit in October 2021, elaborated a Blue/Green Governance and Investment Plan as part of a Transition to Net Zero Action Plan, and bids for central government funds for key actions, due to limited capacity at the regional level (Brighton & Hove City Council, 2021). However, unlike Mayoral Authorities, GBEB has few statutory powers and only an indirect governance and democratic structure.
North of Tyne
The North of Tyne region is located in the northeast of England. The North of Tyne Mayoral Combined Authority (NTCA) was formed in November 2018, following a devolution deal between the UK government and constituent local authorities: Newcastle City Council, Northumberland County Council and North Tyneside Council. The region therefore combines a densely populated city core with one of England’s most rural and sparsely populated counties – Northumberland. The devolved powers awarded to NTCA include funds for regional economic growth and jobs, and funding for adult education to develop local skills.
The North of Tyne region elected its first mayor, Jamie Driscoll, in 2019. In his manifesto, there were pledges to keep wealth generated within the region, stimulate a green industrial revolution, create community hubs, build affordable homes, and provide meaningful adult education (Driscoll, 2019). A ‘Local Green New Deal’ was part of delivering on these commitments, with ambitions to be a ‘zero carbon, zero poverty’ region (North of Tyne Combined Authority, 2022a). A 5-point plan was developed to achieve this vision (North of Tyne Combined Authority, 2022b).

In three years, NTCA have initiated a range of projects and programmes. The main ones are: the Green New Deal Fund, Climate Change Energy and Green Growth Blueprint, Technology Innovation and Green Growth for Offshore Renewables (TIGGOR) Programme and holding a Citizens Assembly on Climate Change. The North of Tyne Green New Deal Fund is an investment fund for low-carbon project support in the form of loans, equity and grants for SMEs, public sector organisations and community groups. The aim is to obtain match funding so that the £9m from NTCA becomes an £18m investment in the region. In addition, the funding criteria requires that every £4,525 of investment saves 1 tonne of carbon emissions per annum, and energy efficiency projects achieve a 10% energy cost reduction (North of Tyne Combined Authority, 2021b).
In December 2022, a new Devolution Deal was announced that will set up a new North East Mayoral Combined Authority, bringing together the three councils in the North of Tyne region with the four councils (Durham, Gateshead, South Tyneside and Sunderland) currently constituting the North East Combined Authority. The new North East Mayoral Combined Authority will be constituted via elections in May 2024. In this report, all figures for the North of Tyne region relate only to the three council areas currently constituting the North of Tyne Combined Authority.
5. Citizen engagement: do local people want a Green New Deal?
Local Green New Deals should involve citizens in the decision-making process. To simulate this, in 2022-23, we undertook extensive citizen engagement activities in both the North of Tyne and Greater Brighton regions. We adopted a mixed method approach, combining quantitative survey data and qualitative data collection through two Multicriteria Mapping (MCM) workshops. The team elaborated this innovative research approach based on:
- Options for reducing energy demand whilst maintaining citizens’ quality of life, as shown in Table 1 (Based on the PLEF low energy demand ‘Transform’ scenario, see Barrett et al., 2022);
- Wellbeing Criteria to understand people’s priorities and values relating to social, economic, and environmental goals as shown in Table 2 (Based on the UN Sustainable Development Goals and the wellbeing framework in Creutzig et al. (2022));
Fourteen climate mitigation options were initially presented in a survey, in which respondents were asked to assess their approval of these options and choose their top three measures contributing to overall wellbeing, based on a set of 20 wellbeing indicators. From the survey findings, six mitigation measures were selected to be discussed in more detail in the focus groups – two of the most preferred, two mid-range and two least preferred measures, in relation to six selected wellbeing indicators – two economic, two social and two environmental (Table 2). Two focus groups were then held with 25 participants from each region, with one in Brighton and one in Newcastle, where participants were asked to score these measures according to their contribution to a set of wellbeing indicators, and then to weight the importance of those indicators, using a version of the MCM methodology (Stirling and Mayer, 2001).
| Options | Description |
|---|---|
| Home energy efficiency | 2,000 houses retrofitted to the Energy Performance Certificate ‘C’ * |
| Affordable public transport | 50% bus fare reduction |
| Active travel | Significant expansion of cycle-hire and bike lanes |
| Car-free zones | Extensive car-free zones to restrict driving through the town centre |
| Nature-based solutions | Substantial re-wilding of local countryside, new nature reserves |
| Plant-based diet | All public building and school meals vegetarian and dairy free |
| * The UK EPC provides a property with an energy efficiency rating from A (most efficient) to G (least efficient) with a validity of 10 years. | |
| Criteria | Description | |
|---|---|---|
| Social | Health benefits | Improved physical and mental health |
| Being part of a safe and supportive community | Increased community resilience and connection, improved protection from crime, access to community services for all | |
| Economic | Value for money | Optimising net social costs and benefits, increased benefits for all from public investment, public investments that consider both economic and social benefits, managing social and economic risks |
| Quality jobs creation | Creation of good quality, flexible and long-term jobs, fair pay and working hours, increased equality, diversity and inclusion, flexible and long-term opportunities to satisfy people’s working and life needs | |
| Environmental | Safe and clean local environment | Increased safety in local areas, cleaner local environment, access to safe, clean, green spaces for living, leisure, and outdoor play |
| Tackling climate change | Reduce CO2 emissions through reduced fuel and energy consumption, public and active transit, buying local products, increasing building energy efficiency, reducing consumption and recycling, reusing, and upcycling | |
Citizen survey
The team undertook a two-phase survey between June and September 2022. In the first phase from June to July, two researchers conducted a face-to-face survey with 46 residents in Brighton. To gain a higher number of responses, a second phase was conducted using a market research company to generate a range of online responses in the Greater Brighton (GRB) and North of Tyne (NoT) regions. This generated a further 566 respondents aged between 18-65+, giving a combined total of 612 respondents, of which 343 were in the Greater Brighton region and 269 in the North of Tyne region.
The figures below present the survey results for Greater Brighton and North of Tyne. In the first pair of figures, the respondents were asked about the extent to which they approve or disapprove of a range of energy demand mitigation measures. The patterns of responses in both regions are very similar, with affordable public transport, sustainable construction materials and home energy efficiency being the most popular measures. Car-free zones and car sharing were less popular, though still with net positive approval scores. Plant-based diets was the only option that had balanced positive and negative or net negative approval scores.

Figure 4 image description
People in Greater Brighton were asked if they strongly agree, approve, neither approve nor disapprove, disapprove or strongly disapprove of suggestions for reducing CO2 emissions. Over 60% of respondents strongly agreed with Affordable public transport, and 28% approved.
- Well over half of the respondents either strongly agreed or approved of Sustainable construction, Home energy efficiency, Community decision-making, Nature-based solutions, Active travel, and Park & ride options.
- Around half of respondents either strongly agreed or approved of Place-based solutions, Mobility hubs, Longer life foods / products & materials, and Cycling networks.
- For Car-free zones, almost 30% of respondents neither approved nor disapproved, with 16% disapproving of the option.
- For Car sharing, 41% of respondents neither approved nor disapproved. Plant-based diet was the least popular option, with 44% of respondents neither approving nor disapproving, 14% disapproving and 11% strongly disagreeing.

Figure 5 image description
People in North of Tyne were asked if they strongly agree, approve, neither approve nor disapprove, disapprove or strongly disapprove of suggestions for reducing CO2 emissions.
- 58% of respondents strongly agreed with Affordable public transport, and 33% approved.
- Well over half of the respondents either strongly agreed or approved of Sustainable construction, Home energy efficiency, Community decision-making, Nature-based solutions, Active travel, Park & ride, and Place-based solutions options.
- Around half of respondents either strongly agreed or approved of Longer life foods / products & materials.
- For Mobility hubs, and Cycling networks, just under half of the respondents either strongly agreed or approved.
- For Car-free zones, almost 30% of respondents neither approved nor disapproved, with 19% disapproving of the option. For Car sharing, 46% of respondents neither approved nor disapproved.
- Plant-based diet was the least popular option, with 38% of respondents neither approving nor disapproving, 19% disapproving and 17% strongly disagreeing.
Respondents were then asked to rank their Top 3 energy demand mitigation measures. Again, the response pattern in the two regions is very similar.

Figure 6 image description
People in Greater Brighton were asked to rank their top 3 energy demand mitigation measures from a list consisting of Household energy efficiency, Affordable public transport, Sustainable / recycled construction, Community engagement in decision-making, Nature-based solutions, Longer life food / products & materials, Active travel, Car-free zones, Cycling networks, Park & ride, Place-based solutions, Plant-based diet, Mobility hubs, and Car sharing.
- Household energy efficiency, and Affordable public transport were by far the most popular options, with 152 respondents ranking Household energy efficiency first, and 55 ranking it second most important. 67 respondents ranked Affordable public transport as most important, with 84 people ranking it second most important.
- Mobility hubs and Car sharing were the least popular, with only 1 and 4 votes at rank 1.

Figure 7 image description
People in North of Tyne were asked to rank their top 3 energy demand mitigation measures from a list consisting of Household energy efficiency, Affordable public transport, Sustainable / recycled construction, Community engagement in decision-making, Nature-based solutions, Longer life food / products & materials, Active travel, Car-free zones, Cycling networks, Park & ride, Place-based solutions, Plant-based diet, Mobility hubs, and Car sharing.
- Household energy efficiency, and Affordable public transport were by far the most popular options, with 127 respondents ranking Household energy efficiency first, and 39 ranking it second most important.
- 47 respondents ranked Affordable public transport as most important, with 67 people ranking it second most important.
- Mobility hubs, Plant-based diet, and Car sharing were the least popular, with only 0, 0 and 1 votes at rank 1.
Finally, respondents were asked about their preferences for four different funding mechanisms for implementing energy demand measures. In both cases, the results clearly show a preference for increased central government funding for local government, and little desire for increases in council tax. Interestingly, the option of municipal bonds, (where councils raise debt to fund climate mitigation measures) was as popular as the UK government’s current competitive bidding approach, despite being a relatively unknown concept in the UK.

Figure 8 image description
In Greater Brighton, the most popular mechanism for implementing energy demand measures was more central government funding for local authorities at 78%, with local council tax increases the least popular option at 10%. Both community municipal bonds and local authority competitive bidding approaches were selected by 40% of respondents.

Figure 9 image description
In North of Tyne, the most popular mechanism for implementing energy demand measures was more central government funding for local authorities at 80%, with local council tax increases the least popular option at 12%. Local authority competitive bidding approaches were slightly more popular (42%) than community municipal bonds (34%).
Qualitative insights from focus groups
While the presented options were generally viewed favourably, how they are implemented influenced which options participants valued for their and their communities’ wellbeing. Critical themes which emerged from qualitative analysis of participants’ group discussions and written comments were: 1) fairness, including distribution and access; 2) affordability and reliability of services; 3) physical and mental health; and 4) environmental protection.
Fairness:
The first theme identified relates to issues of fairness in the delivery of benefits across the region’s population. Participants expressed concerns over the distribution of resources and opportunities, access to services and resources, and how employment opportunities might compare to current jobs, in terms of inclusion, duration and quality. They were concerned with ensuring that segments of the population were not excluded from potential benefits, such as walking and cycling facilities, due to mental or physical abilities or location. Quality job creation was perceived as important – home retrofit interventions were seen as representing opportunities for job creation; however, concerns were raised about the potentially limited duration of interventions and the need to ensure fair pay.
Affordability:
The second theme identified was the affordability of the delivery of these measures by local and regional authorities, as well as the reliability of service delivery. Affordability was highlighted by participants in relation to all of the options, and value for money criteria, in terms of how councils would pay for these measures. The analysis highlighted that affordability (value for money) of local authorities’ initiatives and services is central to policies’ popularity. Participants also highlighted the importance of containing the cost of services, and that people should be able to afford to use them, especially given the current cost of living crisis. For example, household energy efficiency initiatives were seen as very important.
Physical and mental health:
The third theme related to the impact of measures on physical and mental health, contributing to communities’ wellbeing. Health impacts intersect with all of the options and were perceived as important not only for direct health benefits, but also in relation to quality jobs, safe and supportive communities, and providing a safe and clean local environment. Participants emphasised the importance of investing in health-related options, as they could lessen the strain on the National Health Service (NHS). For example, active travel (walking and cycling) was perceived to enhance people’s mental and physical health, by being active and losing weight. Affordable public transport was seen to provide health benefits by reducing pollution, improving people’s mental health via lower fare costs, and boosting mood via opportunities to socialise. Car-free zones were perceived as contributing positively to people’s health due to increased walking and cleaner air (improved air quality).
The health benefits of household energy efficiency were identified as being due to increased warmth and comfort, mould reduction and lower stress relating to the energy crisis. Nature-based solutions were seen as contributing to clean air (improved air quality), and to mental and physical health, for example, by providing opportunities to exercise and enjoy nature.
Environmental protection, leisure and feeling happy:
The fourth theme identified environmental protection, leisure, and feeling happy as a benefit that was relevant to many of the options and criteria. Nature-based solutions, access to a safe and clean local environment and tackling climate change were perceived by most participants as critically contributing to communities’ wellbeing. Benefits to future generations were recognised as crucial in relation to tackling climate change. Among the co-benefits of nature-based solutions identified were: enhanced biodiversity, increased wildlife, wetland restoration, CO2 emission reduction, and improved air quality. Tackling climate change was identified as the most important criterion by participants in Greater Brighton, and in the top three (along with safe and clean local environment, and quality job creation) by participants in North of Tyne. Some participants emphasised the need for serious and urgent action to tackle climate change, and many identified the need to act to benefit current and future generations.
Some participants also identified options including active travel, affordable public transport and nature-based solutions as contributing to a sense of community, through creating opportunities for socialising and community building. However, others emphasised the need for more education around the options and their potential benefits, and the importance of maintaining residents’ freedom of choice. Overall, our findings supported other work highlighting the range of social, economic and environmental co-benefits from energy demand reduction measures, in addition to their contribution to urgent action towards net-zero (Jennings et al, 2019; Jennings et al, 2020; Finn and Brockway, 2023).
Multicriteria Mapping (MCM) in focus groups
In the focus groups, a version of an approach called multicriteria mapping (MCM) was used. This explored different citizen perspectives on the options listed above, and citizens’ reasons for supporting some options more than others. Participants were first asked to score each option (from 1-100) against each wellbeing criteria i.e., to reflect how helpful they felt that measure would be in delivering that wellbeing benefit; participants were then asked to weight the importance of each criterion from 1-100, according to their personal values. These were then combined to give a weighted average score for each option. The distribution of these scores is shown in Figure 10 and Figure 11 for the two focus groups.
Figure 10 presents the weighted average of the scores that each workshop participant gave to each criterion in Brighton. Among the options, affordable public transport, nature-based solutions, and active travel received the highest scores. The average score for all 6 options was favourable (higher than 50 out of 100), but there was considerable variation between participants.

Figure 10 image description
Mitigation options Home energy efficiency, Affordable public transport, Active travel, Car-free zones, Plant-based diet, and Nature-based solutions were mapped against Health benefits, Safe and supportive communities, Value for money, Quality jobs creation, Safe and clean environment, and Tackling climate change. The results for Greater Brighton show Affordable public transport and Nature-based solutions received the highest overall scores, with all options scoring over 50 out of 100.
Figure 11 shows the weighted average of the scores for North of Tyne. Affordable public transport, home energy efficiency and nature-based solutions were respectively ranked highest. Most options had a slightly higher average positive score, compared to the Brighton group, except for plant-based diets, which had a low average approval rating of 47.9 out of 100.

Figure 11 image description
Mitigation options Home energy efficiency, Affordable public transport, Active travel, Car-free zones, Plant-based diet, and Nature-based solutions were mapped against Health benefits, Safe and supportive communities, Value for money, Quality jobs creation, Safe and clean environment, and Tackling climate change. The results for North of the Tyne show Home energy efficiency, Affordable public transport and Active travel received the highest overall scores. Plant-based diets scored the lowest, at 47.9 out of 100.
6. Delivering Local Green New Deals
Building on the citizen engagement results, in the following sections we outline policy proposals for Local Green New Deals. In this report, we focus on demand-side mitigation measures, where local and combined authorities typically have more power and influence to act, although these could be delivered in combination with local renewable energy schemes.
In Table 3 below, we outline strategic national goals that could be achieved through adopting Local Green New Deals across UK regions, together with proposed targets and costings for their implementation in the North of Tyne and Greater Brighton. These are based on regional disaggregation using local data on housing, transport, and income levels. Details of our quantitative, downscaling methodology can be found in the online Technical AnnexOpens in a new tab.
| Objectives | National goals | North of Tyne | Greater Brighton |
|---|---|---|---|
| Cheaper, warmer, zero carbon homes | Almost all homes are EPC ‘C’ or above by 2035. Deployment of energy efficiency and heat pumps delivers a 53% reduction in CO2 emissions from homes. |
313,000 homes are retrofitted, with £1.04bn public investment in fuel poverty reduction, leveraging a total of £2.86bn. This leads to £4.72bn in bill savings by 2045, lifts 45,000 households from fuel poverty and creates around 5,000 new retrofit jobs. |
316,000 homes are retrofitted, with £286m public investment in fuel poverty reduction, leveraging a total of £2.94bn. This leads to £4.84bn in bill savings by 2045, lifts 46,000 households from fuel poverty and creates around 5,000 new retrofit jobs. |
| Affordable, sustainable public transport | By 2040, 100s of new bus routes are developed and the frequency of existing services increases, with bus journeys increasing by 66%. A 44% rise in tram, train, and metro journeys. |
Buses’ relative composition of all journeys increases from 9% to 12%. Buses are rapidly electrified, requiring £2.79bn investment by 2040. A significant £700m expansion of the Tyne and Wear Metro system. |
Buses’ relative composition of all journeys increases from 6% to 7%. Buses are rapidly electrified, requiring £2.1bn investment by 2040. The reintroduction of a tram system in Brighton and Hove, costing between £200-400m (based on systems in similar UK cities). |
| Car-free city centres and active travel | City centres are pedestrianised, cycle lanes are greatly expanded, and high streets are favoured over out-of-town shopping. Combined with improved public transport, this leads to a 21% reduction in car journeys and a 225% increase in walking and cycling. |
Car and van journeys decrease from 63% of all journeys in 2022 to only 38% in 2040. In our 2040 scenario, walking increases dramatically from 8% of all distance travelled to 27% by 2040. Cycling also increases from just 2% of distance travelled to 6%, requiring substantial investment in bicycles and cycling infrastructure – an estimated £770m. |
Car and van journeys fall from 55% of all distance travelled to just 33% by 2040. In our 2040 scenario, walking increases dramatically from 6% to 20% of all distance travelled. Cycling also increases from just 2% of distance travelled to 6%, requiring substantial investment in bicycles and cycling infrastructure – an estimated £610m. |
| Expanding green spaces and nature restoration | Nature-based solutions are promoted in preference to bioenergy with carbon capture and storage. 218.8Mt of carbon is sequestered using broadleaved native woodland, requiring 2338km2, or around 0.96% of the UK’s land area. |
Delivering the local share of afforested land hectares (Ha), would require 51 Ha in Newcastle upon Tyne, 35 Ha in North Tyneside and 4,600 Ha in Northumberland, a total of around 4,700 Ha. Using carbon credit payments, this would cost around £66m by 2040. |
Delivering the local share of afforested land hectares (Ha), would require 32 Ha in Adur, 178 Ha in Arun, 44 Ha in Brighton and Hove, 10 Ha in Crawley, 289 Ha in Lewes, 245 Ha in Mid Sussex, 9 Ha in Worthing – a total of around 800 Ha in Greater Brighton. Using carbon credit payments, this would cost around £11m by 2040. |
What policies are needed?
Some of these activities can be delivered on today, however, in many areas, local government requires greater support to deliver Local Green New Deals. The ability to implement actions is built on a combination of factors. In this report, we focus on three main areas: (1) institutions for delivery, (2) powers, and (3) funding. These are key domains of consideration but are not exhaustive. Local government action will depend on legislated powers, political will, public engagement and support, policy support, removal of barriers, finance, capacity, determination, attitude to risk and, frequently, sheer persistence.
- Institutions for delivery: The efficacy of delivering on net-zero ambitions will be determined by setting the right incentives and putting appropriate organisational structures in place to deliver on ambitions. This could include forums for discussion or delivery organisations, such as Net Zero Hubs and Joint Waste Authorities. This may require wider re-organisation of local government, though this is not something we explore in depth.
- Powers: What local authorities can and cannot do is determined by the legal framework of duties, powers and policies. Powers can be provided through primary legislation or in statutory guidance.
- Funding: From 2013, local authority funding and government-supported schemes for climate change were significantly cut. For example, a decade ago, 2.3 million energy efficiency measures were installed annually through government-backed schemes. In 2021, fewer than 100,000 were installed (CCC, 2022). It is vital that local government is given the financial ability to deliver net-zero initiatives.
6a Cheaper, warmer, zero carbon homes
Reducing energy demand from existing buildings is one of the most difficult challenges we face. Greenhouse gas emissions from housing, commercial buildings and the public sector account for around 41% of the UK’s total emissions, with housing alone contributing 30% (BEIS, 2020). Between 2005 and 2020, these emissions fell by 48%, due to energy efficiency measures and decarbonisation of the electricity supply. The key remaining source of emissions is natural gas used for heating. It is therefore vital that existing buildings are retrofitted to minimise their energy requirements and decarbonise their heating systems.
Improving our homes brings a range of benefits, including reducing energy bills and reliance on imported gas, improving public health, and generating jobs and community wealth (UKGBC, n.d.). However, recent retrofit programmes have failed to deliver at the (much-needed) scale, with roughly 16 million homes needing some form of improvement towards a reasonable standard of Energy Performance Certificate (EPC) C by 2035 (The Cheaper Bills, Warmer Homes report also proposes reforming the EPC system to make it more accurate and incentivise heat decarbonisation, as a key precursor to tightening these regulations). As a result, the UK’s housing stock remains poorly insulated (Nicol et al, 2016), with millions living in fuel poverty (NEA, 2022). These programmes have failed in part due to the piecemeal nature of the offer to households. A fragmented and inconsistent funding environment has plagued the UK industry in recent years, with short-lived funding horizons and complexities surrounding eligibility and implementation leading to frustration within the construction industry and apathy from the wider public.
Current strategy remains lacking, with the government’s 2021 Heat and Buildings Strategy being clear on the goals but light on funded proposals to deliver on its ambition. The basis of this strategy was the aspiration for all owner-occupied domestic properties to be brought up to EPC band C by 2035 (‘Where practical, cost-effective and affordable’.), and by 2030 for rented homes. This would give local authorities a remit to intervene to improve the energy efficiency of some 3 million homes, via minimum energy efficiency standards (MEES). Doing so would require a significant expansion of local government capacity, given that only 17 of the 268 councils have taken any action on enforcing current MEES standards, and only 17 fines have been issued (Cuff, M. 2020). Recently, the UK government
has abandoned MEES for rental properties and has disbanded the Energy Efficiency Taskforce (Cohen, 2023), meaning policy is, once again, rudderless. Similarly, it has weakened its plan to phase out the installation of gas boilers by 2035, instead aiming for an 80% reduction (Wells, 2023).
To tackle the retrofit challenge, a long-term, locally-led, centrally-funded plan is needed. This should support regional authorities to provide grants for low-income households, put in place one-stop shops, develop skills and supply chains, and support local government more widely to enforce standards.
Adopting the costings and methodology from the Cheaper Bills, Warmer Homes report, we downscaled these scenarios to estimate programmes for Greater Brighton and North of Tyne, using the EPC database and local indices of multiple deprivation.
Table 4 below shows the modelled scale and impact of these programmes by 2035, with both regions seeing around 300,000 homes improved, requiring close to £3bn in investment, but generating almost £5bn in bill savings by 2045 (These bill savings also include removing VAT from energy and shifting environmental levies into taxation). Below, we set out some of the key local policy programmes which could deliver on this scale of ambition.
| – | Greater Brighton | North of Tyne |
|---|---|---|
| Share of UK programme | 1.33% | 1.29% |
| Number of affected households | 315,982 | 312,621 |
| Total Capital Investment | £2,936,500,000 | £2,862,700,000 |
| Cumulative bill saving to 2045 | £4,844,500,000 | £4,722,500,000 |
| Total CO2 saving (tonnes) | 2,885,951 | 2,813,299 |
Prioritising fuel-poor homes
In England, fuel-poor households are defined as those in low-income, low energy efficiency homes (In Wales, Scotland and Northern Ireland, if a household spends more than 10% of its income on fuel costs, such that the remaining household income is insufficient to maintain an adequate standard of living, the household is classified as fuel-poor). Variations in definitions and statistical delays mean that the estimated number of households in fuel poverty across the UK ranges from 4.1 million to 7.5 million (End Fuel Poverty Coalition, 2023). Many households will require grants to cover the costs of retrofitting their homes, or a blended finance approach, where the renovation costs are funded partially by grants and partially from low-interest debt. By starting with fuel-poor and low-income households, government investment will be able to address the dual climate and cost of living crises most effectively.
Grant funding can partly be drawn down from existing government funding programmes, such as the Local Authority Delivery (LAD), Home Upgrade Grant (HUG) and Energy Companies Obligation (ECO) schemes. Indeed, local authorities have already proven successful in targeting these programmes. However, committed funds of around ~£1bn/year are inadequate to meet the extent of the need. The Cheaper Bills, Warmer Homes analysis estimates that at least £48.5bn of building fabric grants are needed for low-income households up until 2035. In addition, funding will be required to support households to transition from gas boilers to heat pumps. The same analysis estimates that a £9bn scrappage scheme would enable this transition, with £4.5bn ringfenced for low-income households.

Figure 12 image description
The lowest income decile homes (1) receive 100% grant funding, decile homes 2 receive 80%, 3 receive 60%, 4 receive 40%, and 5 and above receive 20%. There is a greater number of homes in decile 1 in North of Tyne, and fewer in deciles 4 to 9 leading to far greater public investment than in Greater Brighton – £1,045,000,000 in North of Tyne, and £286,300,00 in Greater Brighton.
However, this share of investment is not equal in both locations. The indicative proposed blended finance programme (Figure 12) assumes that homes in the lowest income decile 1 receive 100% grant funding, with deciles 2, 3, 4 and 5 receiving 80%, 60%, 40% and 20% grant shares, respectively. When examining the relative share of households in different income deciles, a far greater share of households in North of Tyne are in the lowest income deciles than in Greater Brighton, and thus receive a much greater share of public investment, with £1,045,000,000 and £286,300,000, respectively.
Public funding for retrofit has typically been short-term and competitive, with funding often only available over short, one-to-three-year funding cycles. This has not given businesses the confidence they need to invest in training and equipment. To address this, any local programme should be accompanied by long-term commitments. While grants will be required for those on low incomes, low-interest debt and blended finance can be suitable for more able-to-pay groups. To enable this, government, via the Treasury and Bank of England, can provide debt at subsidised interest rates to local government. This would enable local actors to set up local low-interest loan schemes. These blended financing offers could then be overseen by the local Retrofit Taskforce and one-stop shop.
Local Retrofit Taskforce and one-stop shops
Retrofitting is often a complicated process, involving many stakeholders (Figure 13). A council-operated ‘one-stop shop’ approach could overcome some of these barriers, by operating as a central point of information and delivery support for residents.
Correctly designed, one-stop shops can effectively raise awareness of the need for retrofit, signpost residents to key resources, and collate information on home assessments, financing options, and contractors for residents. INNOVATE, as well as the UK Green Building Council Retrofit Playbook (UKGBC, 2021) and Local Partnership’s Local Authority Domestic Retrofit Handbook (Local Partnerships, 2023), have compiled helpful resources on setting up a one-stop shop. Retrofitworks – a not-for-profit cooperative of contractors, tradespeople, and community groups – is also active in establishing and promoting one-stop shops across the UK.

Figure 13 image description
- The retrofit customer journey begins at the Entry / trigger point, generated by marketing and outreach, featuring trading standards policy.
- Step 2 is advice and audit through an energy advice service and policy such as EPC or SAP ratings.
- Step 3 is specification and budget through a retrofit designer or architect, and uses policies such as building regulations, RIBA or ARB.
- Step 4 is contractor procurement where the installer is engaged using policies such as public procurement guidelines and competent persons schemes.
- Step 5 is funding and finance through a bank or lender, utilising policies such as ECO, LAD, and FCA regulations.
- Step 6 is installation & quality assurance checked by a retrofit coordinator or building control, and managed through policies such as PAS 2030 / 2035, and HSE.
Coordinating action on retrofit requires a staff team focused on the mission of achieving the retrofit task. One of the most binding constraints on councils is their limited staffing. To overcome this, councils and combined authorities could be supported to put together a Retrofit Taskforce, made up of local and regional government representatives, social landlords, the construction industry, colleges, energy suppliers, industry experts, and investors. Significantly, the taskforce should work in partnership with a regional group of councils, with each dedicating resources and staff to underpin the function of the taskforce. Such an approach has recently begun in both Greater Brighton and Greater Manchester.
The taskforce can develop a delivery plan that is most suitable for the local housing stock, push forward a series of agreed actions, and maximise investment and public funding, particularly to support those least able to pay for retrofitting measures. Managing the retrofit scheme through a designated taskforce can ensure resources are used effectively, and that oversight is maintained across the whole project. The Cheaper Bills, Warmer Homes programme estimated that these local delivery units, alongside citizen engagement and a public information programme, would require around £2bn for a 10-year programme. When downscaling to the regional level, we expect these programmes to require around £27 million in Greater Brighton and £26 million in North of Tyne, or around £2.6 million per year, per region.
Engaging citizens
Reaching net-zero requires citizens to be fully engaged and empowered. Many of the urgent changes and decisions to drastically reduce emissions have a strong local dimension. Government can support local leaders to implement neighbourhood or community-based outreach and mobilisation, which can be critical in overcoming barriers to retrofit. By informing, consulting, involving, co-designing, and empowering, local authorities can convey information on the benefits or processes of retrofit to potential customers more effectively than traditional marketing approaches, and make use of trusted information channels, such as neighbourhood associations and faith groups. Engagement with community groups and local stakeholders can drive greater take-up amongst a wider network of people, by leveraging high levels of trust to overcome barriers to retrofit more effectively.
Therefore, council-led one-stop shops should focus on building community capacity and a personal approach. This should be tailored to reach target communities such as older residents, black and minority ethnic communities, and people who speak English as an additional language. Outreach efforts should also highlight the cost savings of a neighbourhood-based approach. For example, by working on properties simultaneously, Bristol Green Doors facilitated significant savings (approximately £500 in installation costs per household) by retrofitting ten or more properties. Householders involved agreed they would not have taken part in the scheme without grant funding to offset expenses or the support provided by Bristol Green Doors. By identifying and supporting community champions and early adopters of retrofit, local government-led one-stop shops can strengthen local networks and secure long-term commitment to the initiative.
One-stop shop example: Social Economy Retrofit (SELCE)
The South East London Community Energy Co-op (SELCE) provides free energy advice and support, and is partly funded by local government to support community engagement. It was founded by local volunteers concerned about the climate crisis and is a Society for Community Benefit. It works in partnership across Greenwich, Lewisham, Bromley and Bexley with local organisations and councils, to help individuals, businesses and community organisations to navigate the transition to sustainable energy. They offer a range of impartial advice services to help people who are struggling with their energy bills, households who want to retrofit their property, and organisations that are looking to become more sustainable.
Building a skilled workforce
To deliver at the scale required, it is essential that the skills and the workforce for low-energy construction activities are in sufficient supply. To achieve this, the number of appropriately trained net-zero construction workers will need to rise rapidly.
The Cheaper Bills, Warmer Homes report estimates that the programme would create ~260,000 new construction jobs, with an additional ~230,000 indirect jobs in related supply chains. Our downscaling analysis estimates this would require 5,285 newly trained apprentices in Greater Brighton and 5,229 in North of Tyne.
Local leaders will need to map the demand for retrofit against the current supply of retrofit capacity, and use this as the basis for a local strategy that addresses existing skills gaps. Councils and combined authorities should engage local businesses, colleges, and community groups throughout this process. They should also build a retraining plan that targets certain cohorts of the existing workforce, for instance, those with specific skills levels.
While long-term funding for retrofit will itself catalyse businesses to invest in skills, some additional support will be needed for local government to enable this. The Cheaper Bills, Warmer Homes analysis estimates that an additional £400m for new apprenticeships and £100m retraining fund for existing trades would be required for local leaders to deliver ~200,000 new apprenticeships and retraining programmes via local Further Education (FE) colleges. We estimate this requires around £6,448,000 for new apprenticeships in North of Tyne and £6,627,000 in Greater Brighton during the 2020s.
Local one-stop shops should use their procurement systems to support the development of inclusive economies, via Community Wealth Building. To do this, local government should embed its strategic aims into its procurement system, such as by ensuring that council construction contracts meet certain diversity-related targets and higher energy efficiency standards. Strategic insourcing can also play a role and has been used by councils across the country, from Islington to Preston, to improve living standards in their areas. Nottingham City Council, Leicester City Council, Glasgow City Council, and others have established arms-length construction organisations.
These organisations more proactively include women and ethnic minorities, can offer greater opportunities for new entrants to the sector, offer more secure forms of employment, and build to higher standards. Councils ought to identify how they can achieve similar outcomes through their procurement powers, and consider whether in-sourcing construction would more effectively achieve their goals.
Retrofit policy recommendations
Institutions for delivery:
- Central government puts in place a 10-year Local Retrofit Delivery framework. This would support combined authorities and county councils to establish local one-stop shops and Retrofit Taskforces with dedicated staff that support residents to decarbonise their homes.
- Central expertise to support implementation. In addition to devolving funding and responsibilities to local government, it is important that central government provides leadership on best practice in financing, engagement, and skills. The new National Retrofit Hub could be the vehicle for this.
- Citizen engagement. Central government needs to lead the way in engaging the public on the retrofit challenge. Through clear, effective communication, government should make it clear that retrofit is a well-funded national priority. However, local community groups should be provided with the resources to engage citizens on the benefits of these approaches.
- Councils should establish new training courses for tradespeople and skills accreditation, and signpost residents to local, trusted tradespeople. This should be funded by central government.
- Local government should support community organisations and establish direct labour organisations and cooperative development agencies, so that the public money invested in retrofit most inclusively translates into economic opportunities for communities.
Powers:
- Retrofit and fuel poverty delivery should be devolved to local and combined authorities with long-term funding horizons (5+ years) and greater autonomy in how these schemes are designed.
- Government should reintroduce and strengthen Minimum Energy Efficiency Standards (MEES) and devolve enforcement to local government. Government should build local capacity so that councils are able to undertake this task.
- Amend legislation to allow for the introduction of Property-Linked Finance so that the UK can learn from the experience of US counterparts and fully leverage private investment. This type of lending is viewed as lower risk by lenders but will require higher consumer protections to ensure successful implementation (Green Finance Institute, 2022).
Funding:
- National government should allocate £2bn to the Local Retrofit Delivery Framework for devolved administrations, combined authorities, county councils and local authorities. These programmes should look to serve all tenures and local housing types but should prioritise areas of high fuel poverty.
- A programme of grant funding, targeted at low-income households. Central government should make £48.5bn of building fabric grants available for low-income households to retrofit their homes. £9bn should be available for a heat pump boiler scrappage programme, with £4.5bn ringfenced for low-income households. This funding should be committed to for at least 10 years.
- Blended finance. Central government should develop a blended financing offer, tied to the property, not the individual. Combining low-interest debt with grant funding via the Treasury and Bank of England should enable local one-stop shops to offer blended finance to all residents, regardless of income.
6b Affordable, sustainable public transport
A significant shift is needed in public transport use across the UK. The CREDS Positive Low-Energy Futures (PLEF) ‘Transform’ scenario suggests that nationwide, bus journeys should increase by 66%, and train and light rail journeys by 44%, by 2040. Considerable work and investment will be needed to meet these targets. In the absence of action, CREDS modelling indicates that the share of car journeys is expected to increase nationally by 13%, by 2040. To achieve increases in public transport use, local government will need support to significantly improve public transport services, enabling citizens to reduce their car usage. Our local public transport scenarios, shown in Figure 14, use the CREDS PLEF ‘Transform’ scenario, and local data from the Place-Based Carbon Calculator (PBCC), including estimates of the required capital investment. See the online Technical AnnexOpens in a new tab for our full methodology.

Figure 14 image description
For distances travelled by various methods of transport, the patterns of usage are very similar between Greater Brighton and North of Tyne apart from trains, due to the differences in local rail infrastructure.
- In Greater Brighton, the greatest distance travelled in 2022 is by car / van (1.7 million km), then train (0.8 million km), walking (0.19 million km), bus, car passenger, bicycle, motorbike, tram / metro, other mode and finally taxi.
- In North of Tyne, the greatest distance travelled in 2022 is by car (1.6 million km), bus (0.24 million km), walking, car passenger, train, tram / metro, other mode, bicycle and finally taxi.
- Local public transport scenarios suggest that by 2040 in Greater Brighton, car / van use would need to decrease by 22%, walking increase by 14% and train use increase by 2%.
- In North of Tyne, car / van use must decrease by 24%, walking increase by 18% and bus journeys increase by 3%.
Local transport context
The Greater Brighton City Region is made up of Adur, Arun, Brighton and Hove, Crawley, Lewes, Mid Sussex, and Worthing. In Adur, Arun, Crawley, Mid Sussex, Worthing and Lewes, a two-tier system of local government operates. In these areas, the county council (either West Sussex County Council or East Sussex County Council) is the transport authority which holds the funding and decision-making power for transport planning, roads, and public transport. The District Councils are responsible for parking and development planning. The Brighton & Hove Unitary Authority combines the powers of both. This means that there are currently three transport authorities across the city-region.
| – | West Sussex CC transport authority | Chichester |
|---|---|---|
| – | Horsham | |
| Greater Brighton | Adur | |
| Arun | ||
| Crawley | ||
| Mid Sussex | ||
| Worthing | ||
| Brighton & Hove Unitary Authority transport authority | ||
| East Sussex transport authority | Lewes | |
| – | Wealden | |
| – | Rother | |
| – | Eastbourne | |
| – | Hastings | |
Unlike the Greater Brighton City Region, North of Tyne is a Mayoral Combined Authority (CA) area. It neighbours another Combined Authority Area, the North East Combined Authority. While the combined authorities could operate as Passenger Transport Executives themselves, they have joined forces and formed Nexus, which covers Tyne and Wear – the urbanised core of the North East. Nexus combines the transport functions of a local authority (such as parking and development planning) with strategic decisions made at a regional level – for example, local rail service planning.
Following the agreement of a new devolution deal for the North East, North of Tyne CA and the North East CA are merging into one larger mayoral combined authority known as the North East Mayoral Combined Authority. According to the devolution deal, Nexus’ role ‘…as the executive body and officer of both the North East Combined Authority and the North of Tyne Mayoral Combined Authority will be transferred to the new mayoral combined authority in relation to transport functions in Tyne and Wear. Following review by the new mayoral combined authority, Nexus’ role may also be extended to cover transport functions in Northumberland and County Durham.’ (DHLUC, 2022, p.13).
| – | Combined authority | Transport authority | Local authority |
|---|---|---|---|
| North East Mayoral Combined Authority | North of Tyne CA | – | Northumberland |
| Nexus transport authority | Newcastle | ||
| North Tyneside | |||
| North East CA | South Tyneside | ||
| Gateshead | |||
| Sunderland | |||
| – | County Durham |
The Transport Act 2000 imposed a requirement on all transport authorities outside of London to produce a Local Transport Plan. Major funding is determined by the Department for Transport in response to bids from each transport authority, considering their Local Transport Plan. In the North East, the Transport Plan will be refreshed by local authorities by March 2024, before being finalised by the Mayor, once they are in place (DHLUC, 2022).
In Greater Brighton, there are three transport plans in place – one produced by each transport authority. While major funding is determined by competitive bidding, funding for maintenance and smaller scale projects comes from the local authority’s budgets.
Meanwhile, in both regions, National Highways is responsible for motorways and major roads, while Traffic Commissioners, appointed by the Secretary of State (rather than the transport authorities), are responsible for bus licensing. Traffic Commissioners tend to operate at a higher level of geography – with their roles covering the wider North East, as well as the area which will be included in the North East Mayoral Combined Authority. The same is true in Greater Brighton, which is under the purview of the London and South East Transport Commissioner.
Buses
Buses form an important part of public transport that enable people to reduce car use and/or avoid car ownership. They are also a powerful lever for addressing inequality, as households in the lowest 20% of incomes use buses three times more than households in the top 20% (DfT, 2023a). In our 2040 scenarios, we envisage bus usage increasing in both regions by 66%, and the rapid electrification of the bus fleet. We estimate this change to require around £2.79bn capital investment in North of Tyne and £2.1bn in Greater Brighton. This scale of investment would allow a significant expansion of bus routes and an increase in the frequency of services, especially in underserved rural locations. Moreover, changes to the governance of the bus network, as we outline below, may allow for cheaper services and the cross-subsidisation of underserved routes from other areas of the network.
Currently, buses in both North of Tyne and Greater Brighton are run by private operators on a for-profit basis. Because the industry is deregulated, competitors must not consult on routes, prices or any other elements of the business, to avoid being perceived as acting anti-competitively. In addition, the commercial basis of bus operation means that many routes are either profitable in themselves or must be subsidised by the government, with commercial operators having no incentive to use busier routes to cross-subsidise others. This results in a fragmented and dysfunctional system in many places. In both areas, transport authorities are moving towards ‘Enhanced Partnerships’. These allow them to specify, for example, timetables and multi-operator ticketing, while committing the transport authority to providing new infrastructure. The extent to which this infrastructure will be provided is in doubt, as government funding for this has been cut.
In March 2021, the Department for Transport published a National Bus Strategy which pledged £3bn of additional funding. To access funding, local authorities were required to produce Bus Service Improvement Plans (BSIPS) and enter into Enhanced Partnerships with operators. Most transport authorities had opted to go down this route, but in April 2022, it was announced that the available funding had been reduced. Funding was only allocated to 31 of the 79 transport authorities that applied. In total, only £1.08 billion was offered of the £10 billion requested (Campaign for Better Transport, 2022). This means a large deficit remains for bus service improvements.
Mayoral Combined Authorities automatically have the power to take buses under ‘public control’ by directly franchising services, providing that they can unlock powers through a pre-franchising process. This process requires an extensive business case, an independent audit, and a three-month public consultation. Other transport authorities could theoretically also access franchising powers under this Act, but this requires approval from the Secretary of State. Bus franchising allows the transport authority to specify the routes to be operated, their frequency, and gives them the flexibility to adjust this over time. It means the entire network is regulated, designed, and integrated by a public authority, rather than by individual bus operators. These specifications are then put to market as part of the competition to appoint operators for those services. The operators will come forward with proposals, and only operators who win a contract specifying fares, routes, timetables, and standards are allowed to operate services in the publicly controlled area. These bus operators can be publicly or privately owned, and some have operated on a not-for-profit basis.
While bus companies can be publicly owned – and many of the best performing operators are (We Own It, 2023) – it is not currently possible for local governments to set up their own bus companies. The UK government’s March 2021 strategy identified that councils could buy existing companies and that the ban on municipal bus companies was ‘ripe for review’ (UK Parliament, 2023). Public ownership of bus companies allows for profits to be reinvested in services and for greater cross- subsidisation of unprofitable routes by profitable ones.
For example, Lothian Buses, which is municipally owned, paid its £7.7m profits to its public sector owners, increasing funding for local public services (Lothian Buses, 2019). Had this been a private operator, the money would most likely leave the local area and the country all together with the ‘big 5’ – mostly foreign-owned bus companies paying out to shareholders (We Own It, 2023).
Case study: Greater Manchester bus municipalisation
Greater Manchester’s bus network is being brought back under public control. The region’s buses will be run in a London-style system where operators bid to run services on a franchise basis. Mayor Andy Burnham approved the plans, saying privatisation had brought ‘35 years of routes being cut and ticket prices rising’. The franchise model, estimated to cost £135m, was backed by nine of the region’s ten councils.
Since the buses were privatised in 1986, Mr Burnham said some areas in Greater Manchester had ‘no services at all’, ticket prices had risen and routes had been cut, while passenger numbers had halved. ‘We can only change that and hold the decline if we bring the buses back under the control of the public and the public authorities of Greater Manchester,’ he added. This means fares, timetables and routes will be set by local authorities instead of private companies, but operators may be able to continue running services under a franchise system (BBC, 2021).
Rapid transit and light rail
Rapid transit on metro, tram, or underground services is a key part of transport decarbonisation for large urban areas, as this can encourage a modal shift away from cars. Light rail systems can also help to encourage people to use their cars less. According to the Urban Transport Group – a grouping of the public sector transport authorities for the UK’s largest city regions – 30% of tram users in Nottingham switched to trams from cars, and 29% of Manchester Metrolink users and 42% of Tyne and Wear Metro users reported that they would use a car if the tram was not available. Transport authorities can develop rapid transit system proposals, but they require central government legislation and funding, and there is a complex interaction between the transport authority and central government before any development can take place. The power to set up a new light railway lies with the Secretary of State under the Transport and Works Act 1992 (UK Legislation, 1992).
In the Greater Brighton region, there is no rapid transit system in place, though council leaders have identified the need for one in the past (Built Environment Networking, 2019). These proposals could see a tram system replacing some of the road lanes in central Brighton and potentially expanding outwards along the coast towards Seaford in the East and Shoreham in the West. Tram systems have cost between £200-400m in similar UK cities (UK Tram, 2012).

In North of Tyne, there is the Tyne and Wear Metro, overseen by the regional transport authority Nexus (discussed above). North East transport leaders recently proposed a £700m ambition of extending the Tyne and Wear Metro (ITV News, 2022) to Washington – the fourth largest town in the country without a train station. The loop would use a section of the Leamside line to bring Metro trains through Follingsby to Washington and then over the Wear and past Penshaw, to join the system’s current end-point at South Hylton. It is hoped the move could lead to a series of new stations in areas that have been without trains for years.

A key stumbling block for these proposals is funding, which has often not been forthcoming for these types of projects outside of London. Important lessons can be learned from countries such as France, which has successfully reintroduced trams to its major cities beyond the capital.
Case study: French trams
Starting from the mid-1970s, France developed a tram industry that built on the incumbent rail sector to become a world leader that exports its services globally. The development was supported by a relatively coherent and specific vision from government, and the devolution of powers and revenue raising abilities to local government. This, together with more a more widespread mayoral system, has meant that local democratically elected leaders have been able to campaign on commitments to creating tramways, and almost 30 cities now have tramways.
Local transport planning administrations evaluated plans, working closely with technical bodies, research centres and specialised government-affiliated technical services to accumulate and disseminate knowledge. Much of this expertise was initially derived from considerable expertise and research capabilities in the nationalised French rail industry, including train and signalling designs, component manufacturing, system integration, and operations.
New, devolved funding streams were developed to support transport planning, most significantly the versement mobilité (VM, originally known as the Versement Transport when introduced in 1971). The VM is a local tax paid by public and private sector employers with more than eleven employees, and is dedicated to funding transportation networks. It is charged at variable rates, but the standard rate is 1.5% of payroll. The VM is the main component of urban public transportation funding in France, accounting for almost half of total revenues for mobility authorities, at €8.2 billion per year. The VM has been used to finance modernisation, invest in alternative means of transportation, contribute to improving intermodal connections and even to plan fare-free travel in certain medium-sized urban areas, such as Aubagne in 2009 and Dunkirk in 2018 (La Fabrique de la Cité).
The tram worked effectively with the existing mayoral system in French cities. Mayors and mayoral candidates in cities across France were given the opportunity to define themselves in electoral races using tramways. As the powers and funding tools were devolved, this allowed them to effectively make commitments to these networks.
Their creation also became ‘an ideal instrument of urban marketing’ for these officials.
Local rail
UK rail legislation and policy is developed nationally and is centralised within the Department for Transport (DfT). Almost all aspects of rail infrastructure are overseen by central government, and Acts of Parliament are required to open or close even local stations. Local authorities are only expected to have planning input into railways in metropolitan areas with a Passenger Transport Executive. In September 2020, the DfT announced that rail franchising would end, and the government would reform the rail operating system, ‘bringing Britain’s fragmented network back together’ (DfT, 2020). However, the creation of the statutory body to deliver this reform, dubbed ‘Great British Railways’, is unlikely to come about ahead of a 2024/25 general election (Ames, 2023), as the legislation required is unlikely to be given parliamentary time.
Currently, competition between different forms of public transport can be an issue for rail services, with commercially operated bus services competing with train services. Connectivity is also an issue, with bus services limited in how much they can adapt their schedules to rail schedules given that they are legally bound to run their services to timetables. Additionally, limited space for bikes on many rail services and a lack of integrated ticketing further hamper connectivity with other transport modes.
Case study: funding Crossrail
The Crossrail project (now the Elizabeth Line) delivered a new east–west hybrid commuter rail and rapid transit system across London. The scheme had a total funding envelope of £14.8bn, of which £6.7bn came from a government grant (both Transport for London and DfT) (Buck, M. 2017). In addition to this, Network Rail financed £2.4bn of the work required on the existing network.
This then required a substantial additional contribution from those who would benefit most from it. The Greater London Authority (GLA) worked closely with key stakeholder businesses to develop a consensus for the introduction of these measures.
The remaining £5.7bn (39%) came from beneficiaries of the scheme via various mechanisms:
- Business rates supplements (BRS): In April 2010, the mayor of London levied a £0.02 supplement on business rates for properties of a rateable value over £55,000 per annum – meaning smaller premises were exempt and the burden would fall on larger businesses. The BRS generates around £225 million per annum, which could support borrowing of around £3.5 billion for the GLA. The levy is expected to fall away once the borrowing is fully repaid in the 2030s.
- Land value capture: An additional levy was imposed within the existing Community Infrastructure Levy (CIL) on both commercial and private residential development. As with the BRS, this was earmarked for Crossrail. The levy is set at the time of planning consent but is only payable on completion, allowing local government to capture some of the property value uplift driven by the improved infrastructure. After a slow start, the CIL was generating £100 million a year by 2015–2016.
Public transport policy recommendations
Institutions for delivery:
- Establish central advisory bodies with expertise on bus and rapid transit. These should include government-affiliated technical services to accumulate and disseminate knowledge, as well as research centres and less technical advisory organisations.
- Review the functional geography of transport authorities, laying out a long-term plan for reform, so that areas like Greater Brighton have transport authorities that oversee their whole region.
- Integrate rail planning with local transport planning. Local transport authorities currently have little oversight of rail networks operating within their areas. This ought to be addressed so that local government can more effectively influence the provision of services and ensure that they are connected as part of a well-planned network.
- Local governments should establish wholly owned arm’s length development companies that invest alongside infrastructure projects, so that land value appreciation can be directly captured. Many LAs are doing this already to some extent (Morphet and Clifford, 2017).
Powers:
- Give control over buses to all transport authorities via franchising or equivalent means. Franchising currently takes many years to put in place, so government should review options for most effectively enabling locally-led public control of bus services.
- Lift the ban on municipal ownership of bus operators, allowing profits to be reinvested and some routes to be loss-leading.
- Move towards a not-for-profit system of bus services. For-profit bus franchising provides operators with an effective monopoly on services, with fares in danger of becoming increasingly unaffordable, while most innovation comes from the public planning of the system. This is likely to represent poor value for money.
- Devolve the powers for setting up a light rail system to local government. As the French case study illustrates, investments in local transport infrastructure can be a locally-led, democratic decision. To do this, both funding and powers will need to be devolved.
- Government should look to establish trailblazer cities where local leaders can be given more power to fund and establish rapid transit systems, learning from the French example.
Funding:
- Expand funding to match the investment needed by local government. Local government recently requested £10bn to deliver their bus service improvement plans (BSIP), which is in line with the required funding identified in the PLEF ‘Transform’ scenario. This scenario anticipates that an investment of £37.26bn is needed nationwide in bus services and £7bn in local rail services until 2040.
- Local employer tax: give local areas the ability to tax large local employers. This could take the form of a business rate supplement, as in London to support Crossrail, or tax linked to payroll, as for France’s trams. We recommend an options analysis, to ensure that the tax does not fall too hard on the shoulders of place-based businesses.
- Strengthen current mechanisms for capturing land value uplift. Today, the main tools for securing uplift for the public sector are ‘developer contributions’ through Section 106 agreements (Section 75 agreements in Scotland), and the Community Infrastructure Levy (CIL). Legislation is currently going through parliament that will partially replace CIL and S106, based on the percentage of a site’s Gross Development Value, rather than on floorspace. Alternatives include land value taxes, which have been successfully deployed elsewhere.
- Reform the land development process and deliver better value for money. The current system means that private and public sector actors support landowner profits. To ensure that enough land is made available and assembled for new development, new public and democratically accountable Development Corporations should be empowered to purchase, develop and sell land in the public interest (These Development Corporations would then be able to follow the example of the Hong Kong Mass Transit Railway Corporation (MTRC), which buys land at existing use value, builds rail infrastructure and accompanying developments, then leases the surrounding land to businesses at prices that reflect the presence of the railway and adjacent developments. By doing so, they have a direct mechanism for capturing land value). These should be supported with patient finance by regional development banks and a reform of the land compensation law, so that no account is taken of prospective planning permissions when compensating owners for land designated for housing and infrastructure.
- Reform appraisal tools for large capital projects. Large scale rapid transit networks must pass stringent Benefit-Cost Ratio (BCR) tests with criteria set out by central government (the WebTAG system). These tools are effective for modelling marginal changes but often underplay the benefits of more systemic change. This means it is difficult to make these BCRs stack up, even though metro, tram and local rail systems often see much greater passenger numbers once opened than predicted in modelling.
6c Active travel and car-free zones
Our current transport system is heavily dependent on cars. In North of Tyne, cars currently account for 63% of all journeys, and in Greater Brighton, they make up 55% of journeys. Cars are part of transport systems which underpin much economic and social activity. They do, however, come with significant costs:
- Public health: In the UK, air pollution is the largest environmental risk to public health, and cars are a key source of this pollution. The annual mortality of human- made air pollution in the UK is roughly equivalent to between 28,000 and 36,000 deaths every year (DfT, 2023b ). In addition, around 30,000 people are killed or seriously injured in car accidents each year.
- Financial costs: Cars are expensive to buy and operate. CREDS PLEF scenarios illustrate that the total cost of net-zero is lower where fewer journeys are taken by car.
- Land use: Cars and their associated infrastructure account for a high proportion of land use in towns and cities. Car users are heavily subsidised in using this land. For example, in Westminster, the space of a single parking spot would cost about £8,000 a year to rent if it was housing (The Guardian, 2017). Instead, the council charges a maximum of £166 to residents for an annual parking spot. This land could be used for more beneficial purposes, such as planting greenery or café seating areas.
- Climate impacts: Transport produced 24% of the UK’s total emissions in 2020 and remains the largest-emitting sector in the UK. The majority (91%) of emissions from domestic transport came from road vehicles (89 MtCO2e). The biggest contributors to this were cars and taxis, which made up 52% of the emissions from domestic transport (51 MtCO2e) (DfT, 2022).
The role of cars will need to reduce, with a greater emphasis on public transport and active travel if we are to achieve net-zero. To model the increase in active travel and decreased car usage, we adopted the same approach using the PLEF ‘Transform’ scenario and PBCC datasets. Here, car and van journeys will need to decrease from 63% of all journeys in North of Tyne in 2022 to only 38% in 2040. In Greater Brighton, car travel will similarly need to fall from 55% of all distance travelled to just 33% by 2040.
As car use falls, the number of walking and cycling journeys will need to increase. In our 2040 scenario in North of Tyne, walking increases dramatically from 8% of all distance travelled to 27% by 2040, while in Greater Brighton, walking increases from 6% to 20% of all distance travelled. Cycling also increases from just 2% of distance travelled to 6% in both North of Tyne and Greater Brighton. While the public health benefits of increases in walking and cycling are well understood (The Health Foundation, 2021), investment will also be required to support this transition. The figure below (Figure 17) shows the dearth of investment in active travel in England (NAO, 2023). Increasing cycling will require substantial investment in bicycles and cycling infrastructure, with an estimated £610m invested in North of Tyne and £770m in Greater Brighton, respectively.

Roads and active travel infrastructure
In England, different types of local authority have differentiated functions and responsibilities. County councils have responsibility for highways, excluding the strategic roads network, which is controlled by National Highways. Meanwhile, District Councils have responsibility for spatial planning, while on-street parking is a highways issue. The two-tier system can act as a barrier to effective and coherent action on emission reduction.
In Greater Brighton, West Sussex CC and East Sussex CC have responsibility for highways, while the district councils have responsibility for planning and parking. In Brighton & Hove, these powers are all held by the Unitary Authority. In North of Tyne, the system is less fragmented, but the two-tier system still means that Nexus oversees highways (excluding strategic roads), while District Councils control parking and planning.
Authorities with the power to make highway improvements can alter the layout of streets and make more space for walking and cycling. Significantly, the widening of pavements and the creation of cycleways adjacent to highways can be done at short notice within existing powers, as there is no requirement to consult (UK Legislation, 1980). Other legislation gives local government the power to restrict vehicle traffic to create pedestrian and cycling friendly areas by means of a traffic restriction order (TRO). This can be used to create schemes such as Low-Traffic Neighbourhoods.
These can be implemented to limit traffic caused by vehicles using the streets to get to other destinations (Sustrans, 2020), while still allowing vehicles to access homes via another route. The aim is to open up networks of streets where people can travel more safely through the area on foot, bicycle, by wheeling or by bus. Emergency vehicles are also allowed to use the roads.
Evidence suggests that 6 in 10 people living in LTN areas support the scheme in their local area, while 3 in 10 oppose it, with significant regional variation (DfT, 2021). A meta-analysis of traffic data presented in monitoring reports from 46 LTN schemes in 11 London boroughs, introduced between May 2020 and May 2021, found that LTNs have substantially reduced motor traffic on internal roads, without shifting traffic onto boundary roads (Possible, 2023).
The introduction of LTNs has been politically contentious (ITV News, 2023), and the government is now conducting a review into them, the extent of which is still unclear at the time of writing (Vaughan, 2023). LTNs have also been closely linked to other traffic reduction policies, such as 15-minute cities and Clean Air Zones, which we discuss below.
Clean Air Zones
Local authorities are required to review air quality and designate Air Quality Management Areas (AQMAs) if air pollution is too high (UK Legislation, 1995). Once designated, local government must work towards improving air quality by producing an Air Quality Action Plan (AQAP) that describes the measures that will be put in place. These measures can include Clean Air Zones (CAZ). The framework for CAZs has been established by Defra as a tool for addressing NO2 pollution (Defra and DfT, 2022), and involves charging motor vehicles based on how polluting they are. Vehicles that do not meet minimum emissions standards, set nationally, for their vehicle type need to pay a charge before entering a CAZ, with the charges set by local government.
In addition to CAZs, there are local variants, including London’s Low Emission Zone (LEZ) (TfL, 2023a) and Ultra Low Emission Zone (ULEZ). There are also Low Emission Zones operating across Scotland. There are seven clean air zones across England, and four Low Emission Zones operating across Scotland (Low Emissions Zones Scotland, 2023). All of these zones operate in a similar way. Grace periods and financial support are often offered alongside these to reduce the impact on local businesses and residents.
Local leaders are often reluctant to charge their residents, particularly where public transport connectivity is somewhat limited. The recent expansion of ULEZ in London was accompanied by a £160m scrappage scheme (TfL, 2023b).
The scheme offers London residents and businesses £9,500 to scrap a van and replace it with an electric van, and lower amounts for cars and motorbikes. Some have raised concerns about the funding being insufficient and ill-suited to businesses based just outside the capital that operate within London.
Authorities are also limited by their lack of oversight of the strategic road network, which is overseen by National Highways. This means that, as in the case of the A1 in North of Tyne, local government is unable to introduce CAZs to tackle pollution in some of the worst affected parts of their region. In addition, transport authorities’ obligation to fulfil their Network Management Duties, which require ‘the expeditious movement of traffic on the authority’s road network’, has resulted in calls to remove traffic calming measures (UK Legislation, 2004a).
Road pricing
Unlike charges associated with Clean Air Zones, road pricing is typically less directly linked to emissions, but instead is focused on road use. Nationally, drivers in the UK are currently subject to two principal motoring taxes: Vehicle Excise Duty (VED), which is levied on vehicles registered in the UK, and Fuel Duty, which is levied on the fuel used.
According to the Transport Select Committee on Road Pricing, policies to deliver net-zero by 2050 ‘…are likely to result in zero revenue for the government from motoring taxation by 2040.’ They urge the government to urgently replace these taxes with alternative road pricing schemes (House of Commons, 2022). With the £35bn of revenue generated by VED and fuel duty due to fall to zero by 2040 if the current exemptions remain in place, government urgently needs to act to ensure it is funded for years to come.
Local road pricing and congestion charges are also permitted in England, Wales and Scotland. These allow transport authorities to enforce road charging mechanisms and impose penalties on vehicle owners. In England, charges can be introduced by County Councils; Metropolitan District Councils; Transport for London; a London Borough Council or the Common Council of the City of London; and Passenger Transport Executives/Integrated Transport Authorities. Currently, the London congestion charge consists of a daily fee of £15 for driving within central London during charging times.
Case study: Singapore road pricing
Unlike London, which has a flat fee for driving in the congestion zone, Singapore’s system of road pricing charges different amounts depending on the time of day, vehicle size and specific route. The system has raised a lot of money – equivalent to 10% of the local transport authority’s income (Rodrigues, 2022). In addition, Singapore requires that residents have a certificate of entitlement (COE) – a 10-year permit that allows residents to own a car. These are purchased under auction and, as of July 2023, averaged at £ 58,000 for a car under 1600cc. Both policies have been effective in making Singapore a very liveable city despite its density (UN CTCN, 2011).
Parking and planning
Local authorities can restrict workplace parking by charging an annual levy on workplace parking spaces. This has only been introduced by one council so far – Nottingham City Council – which we discuss in the case study below. Residential parking in new developments can be affected through local planning guidance. This guidance must comply with The National Planning Policy Framework (NPPF) which states that ‘local planning authorities should only impose local parking standards for residential and non-residential development where there is clear and compelling justification that it is necessary to manage their local road network.’ This may be serving to restrict local government action in this area. Planning guidance in London has been updated to set the maximum amount of parking for new residential developments. These are determined at a borough-by-borough level but are estimated to have reduced parking provision for new developments by 40%.
Brighton and Hove Council, one of the seven local authorities in Greater Brighton, has issued planning guidance stating that planning permission will be given to car-free housing in areas covered by a controlled parking zone (CPZ) with good access to public transport and local services, removing the right to parking permits (exceptions are made for disabled residents). The requirement is maintained through covenants on future residents. This approach has been rolled out to smaller schemes to mitigate the impact of overspill parking. The council is also investigating the impact of making parts of the city centre car-free.
Case study: Nottingham workplace parking levy
In October 2011, Nottingham introduced a workplace parking levy which charged employers who provide workplace parking spaces. The current charge per parking space is £522 a year, payable by the employer (UK100, 2023). At the time, Transport for Nottingham estimated traffic congestion was costing the local economy £160 million a year and was forecast to rise (Transport Nottingham, 2022). The scheme helps to tackle this by incentivising employers to reduce their parking provision, while also helping to fund major transport infrastructure. Over ten years, the scheme raised almost £90 million to be re-invested in transport across the city. It also allowed the transport authority to bring in inward investment of over £1 billion.
The scheme was co-funded by Nottingham City Council and central government, and cost £1.8 million to set up. Councils looking to replicate the scheme would likely experience lower costs and risks, because Nottingham has already devised a feasible model and is able to offer advice. The scheme was introduced in the face of strong opposition from most of the city’s business community, and it remains the only example of a local authority which has introduced a Workplace Parking Levy, although Oxford City and Oxfordshire County Councils are consulting on their proposals. Leicester City Council’s plans for a similar scheme were dropped in November 2022, citing the cost of living crisis as a factor (UK100 2023).
Moreover, Nottingham already had high public transport usage, as well as strong tram and bus networks and cycling schemes. These likely contributed to the scheme’s success.
Case study: Japanese parking
In Japan, on-street overnight parking has been banned for decades and to have a car, residents must provide proof that they have access to a parking space, which can be owned or leased (Barter, 2014). The policy was aimed at ensuring that the narrow streets of Japanese cities were not clogged with cars, rather than reducing car ownership. The policy has meant that Tokyo has high public transport use, high population density, and ranks as one of the most cycle-friendly cities, despite having little cycling infrastructure (Szubski, 2016).
Walking and cycling
Local government can influence walking and cycling directly, via the creation of new infrastructure, and indirectly, via planning policy. Local authorities are encouraged to attract central government investment by creating a Local Cycling and Walking Infrastructure Plan (LCWIP). This can then be leveraged in bids for funding. Bids have to be justified using government’s WebTAG guidance.
The models used to assess funding bids put a high value on free-flowing vehicle traffic and almost no value on active travel. This is a massive inhibitor of low-carbon transport schemes, wherever funding decisions are not devolved or specifically ring-fenced for active travel. Funding is often actively channelled into schemes that make roads less attractive to people on bikes, in wheelchairs or walking because there is no decision- making method to account for health and carbon benefits. Effectively, funding is channelled into maintaining a myth of free-flowing traffic, whilst making low-carbon forms of transport less safe and less attractive.
Car-free city centres and active travel policy recommendations
Institutions for delivery:
- Central government needs to lay out a clear vision for low-traffic town and city centres that illustrates how cars usage will be restricted, while public and active transport will be supported. Less car traffic means faster buses (Stagecoach, 2023), and more cycle-friendly streets. An approach that recognises this will be more efficient, fairer, and less costly for government, than a reactive piecemeal approach.
- National Highways should be required to work with local government to tackle emissions on the strategic roads network.
- Empower and fund local development corporations to develop transport-led housing, as discussed in depth in the previous section. Government should look to international examples of upfront capital investment for transport-led development, expenditure on public-led land assembly at existing use values, and local revolving infrastructure funds which enable local government to benefit from the gains of land value uplift.
Powers:
- Low-Traffic Neighbourhoods should be made less difficult and expensive to set up. Government should review TROs and replace them with a more streamlined and fit-for-purpose tool.
- Strengthen local government tools to protect cyclists. Taking action against vehicles blocking cycle lanes is currently difficult and cannot be enforced without local government making a specific application to enforce moving traffic violations. This system should be simplified (UK Legislation, 2004b).
Funding:
- Review and reform taxes and charges on roads and parking. By laying out a clear plan for road charging, government can reduce the cost of the transition and ensure that the cost of car usage reflects its social and environmental impact. This will involve charging users more in densely populated areas and where public transport connectivity is higher. It should also include appropriately charging for the public land used by parked cars. This will fill the funding gap created by falls in fuel and excise duties.
- Devolve and pool local authority transport funding to provide longer term certainty, with funds allocated in a non-competitive way, based on local transport plans. Local authorities require greater devolution of transport funding and wider powers to enable the coordination and delivery of integrated net-zero transport networks that are appropriate for local areas.
- Radically reform appraisal tools for large capital projects, to properly capture the benefits of active travel and public transport. Transport investments must pass stringent Benefit-Cost Ratio (BCR) tests with criteria set out by the central government (the WebTAG system). These tools are good at modelling marginal changes but often underplay the benefits of more systemic change. Additionally, they are ineffective at modelling the health and carbon benefits of active travel and transport investment more widely, skewing appraisal outcomes.
6d Expanding green spaces and nature restoration
The UK has been quick to set binding targets to tackle the nature and environmental crises. In 2019, it made a legally-binding commitment to bring UK net carbon emissions to zero by 2050 – the first commitment of its kind by any major economy (BEIS, 2019). Similarly, in 2021 as part of the Environment Act for England, it committed to halt the loss of species abundance in England by 2030, making England the first country in the world to set a legally binding target for biodiversity.
It has also committed to significant, though not legally-binding, targets in habitat restoration, pledging that by 2030, it will protect 30% of land in England for nature (the ‘30×30’ goal). While existing National Parks (NPs), Areas of Outstanding Natural Beauty (AONBs) and other protected areas already comprise approximately 26% of land in England (PM’s Office and Defra, 2020), the Wildlife & Countryside Link argued ‘National Parks and AONBs should not be counted toward the 30×30 target’, as many are in a poor state. The government’s more recent Nature Recovery Green Paper now accepts this (Defra, 2022a, p.22), meaning government is facing a huge uphill struggle to meet its 30×30 commitment and must find new ways to make up the shortfall left by taking out NPs & AONBs.
Our green spaces and nature restoration scenarios are derived from the PLEF afforestation targets, again using the ‘Transform’ scenario. Here, nature-based solutions are promoted in preference to bioenergy with carbon capture and storage, due to the latter likely driving large amounts of land use to monocultures with low efficiency of energy production. In this scenario, it is assumed that by 2040, a cumulative 219 Mt of carbon is sequestered nationally using afforestation approaches. The Committee on Climate Change (CCC) has recommended increasing UK woodland cover from 13% currently to 17%-19% by 2050 (CCC, 2020, p.8 & 12). It has also recommended that we should be aiming to plant around 30,000 hectares of new woodland in the UK every year until 2050 – which would cumulatively mean planting around 800,000 hectares of woodland. In 2021/22, an estimated 13,800 hectares of new forest were planted in the UK, well below the target. The current government target foresees 415,000 hectares of new tree canopy cover in England by 2050, of which just 278,000 hectares would be woodlands and 137,000 would be agroforestry (tree planting integrated into agriculture) (Defra, 2022b). This is well short of the ambition deemed necessary by the CCC.
Even within the current targets, as the CCC has said, ‘Few details have been set out for delivery mechanisms in the agriculture sector – a combined decarbonisation strategy for agriculture and land is urgently needed.’ (Shrubsole, G. 2020a; Terra Sulis Research CIC, 2020).
Afforestation programmes
The UK is amongst the least-forested countries in Europe, with around 13% of land covered by woodland (10.1% in England). This is much improved from the low of just 5% at the beginning of the 20th century but well below the European average of 46%. France, Germany, and Italy each register rates above 30% (Forest Research, 2023).
It is well understood that sustainably managed forests can sequester carbon in the form of biomass, deadwood, litter and forest soils (UNECE, 2023). The rate of CO2 capture is closely related to tree growth rate and wood density, and differs between species (Woodland Carbon Code, 2019). In addition to the direct role that woodland plays in carbon sequestration, woodland can contribute to ensuring that climatic conditions remain hospitable, by supporting the biosphere, which in turn helps to regulate the climate (Wikipedia Contributors, 2011).
Beyond carbon, trees can provide a range of other benefits. They improve air quality, reduce ‘urban heat island’ effects, provide timber, wood and wood fibre products, enable people to re-connect with nature, provide spaces to improve health and wellbeing, help to reduce flood risk, and can reduce the costs of water treatment (Defra, 2018). They are also needed to increase the UK’s economic resilience, as the UK currently imports 80% of the wood it uses, making it the second largest net importer globally, after China (Forest Research, 2022). Much of this comes from countries where deforestation risks are high (WWF, 2020).
In scaling the PLEF ‘Transform’ scenario down to our regional focus, we assume that only a sub-set of land would potentially be available for afforestation, namely landfill and waste disposal, agricultural land, and natural land. Figure 18 shows the dominance of rural local authorities in this reforestation picture, with Northumberland having a greater share of potential than the other LAs combined.

Figure 18 image description
Areas of afforested land by local authority in Greater Brighton: Adur 32ha, Arun 178ha, Brighton and Hove 44ha, Crawley 10 ha, Lewes 289 ha, Mid-Sussex 245 ha, and Worthing 9 ha, making a total of 807 ha. In contrast, areas of afforested land in North of Tyne are: Newcastle upon Tyne 51 ha, North Tyneside 35 ha, and Northumberland 4623 ha, making a total of 4709 ha.
Current government policy to encourage tree-planting is incentive-driven. The UK government has introduced several tree-planting schemes, which require landowners or councils to apply for funding. For woodlands, this includes the England Woodland Creation Offer (EWCO), which offers land managers public money for woodland creation and maintenance, and offers additional contributions where the design of woodlands will deliver public benefits.
Other funding includes the Local Authority Treescapes Fund and the Urban Tree Challenge Fund. To estimate the costs of carbon sequestration, we use data from the Woodland Carbon Guarantee, which typically provides landowners and forest managers between £10-20/tonne (£15 central) for afforestation projects in the UK. Table 5 shows these afforestation costs and carbon savings for North of Tyne and Greater Brighton based on the ‘Transform’ scenario for 2040.
| Afforested Land (Ha) | tCO2 | Carbon Sequestration Costs | |
|---|---|---|---|
| North of Tyne | |||
| Newcastle upon Tyne | 51 | 48,193 | £722,897 |
| North Tyneside | 35 | 32,400 | £486,000 |
| Northumberland | 4,623 | 4,326,499 | £64,897,479 |
| North of Tyne Total | 4,709 | 4,407,092 | £66,106,375 |
| Greater Brighton | |||
| Adur | 32 | 29,626 | £444,388 |
| Arun | 178 | 166,702 | £2,500,526 |
| Brighton and Hove | 44 | 40,907 | £613,608 |
| Crawley | 10 | 9,651 | £144,764 |
| Lewes | 289 | 270,414 | £4,056,211 |
| Mid Sussex | 245 | 229,326 | £3,439,891 |
| Worthing | 9 | 8,355 | £125,323 |
| Greater Brighton Total | 807 | 754,981 | £11,324,710 |
| £/ha | £14,038 | ||
Outside of government funding, there is increasing interest from private finance in the potential for monetising carbon sequestration based on agricultural land use change. This may provide some opportunities for farmers but also poses risks in distorting the land use market.
Reforming agricultural subsidies and food systems
The government is introducing schemes to replace the Countryside Stewardship scheme and wider area-based agricultural subsidies. These schemes, known as Environmental Land Management schemes (ELMs) all have potential elements of agroforestry and woodland creation within the current designs. Currently, two of the three tiers of ELMs – Local Nature Recovery and Landscape Recovery, which will replace the Countryside Stewardship scheme – are only expected to lead to 300,000 hectares of habitat restoration, or just 2% of England’s land area (Defra, 2022c). This is clearly not sufficient to meet the shortfall in protected and restored land needed to meet 30×30, or meet the scale of tree-planting required.
To influence land use change, it is also important to consider food systems more widely. Around 50% of Earth’s habitable land is used for agriculture (National Food Strategy, 2021: p 8), while forests make up 37%. Even though meat and dairy only account for one third of our calories, 85% of the land used to feed us (both here and abroad) is used for livestock farming. Plant-based proteins produce, on average, 70 times less greenhouse gas emissions than an equivalent amount of beef and use more than 150 times less land (National Food Strategy, 2021: p 160).
Reducing livestock farming has the potential to have the largest impact on land use change. The independent National Food Strategy (NFS), which has been largely ignored by government, shows that calorific production is heavily concentrated in certain parts of the country, such as the East of England. Meanwhile, it argues, we could effectively stop farming on 21% of our least productive land and only have a 3% impact on food production (National Food Strategy, 2021: p 41). At the same time, the NFS notes that this least productive land is generally the same land where we find most of our carbon-rich peat soils – where land is most suitable for broadleaved woodland regeneration and most national parks are located (National Food Strategy, 2021: p 93). In addition, this least productive land is occupied by farms that are likely to be unprofitable without subsidy – as is the case for 38% of UK farms (National Food Strategy, 2021: p 31). These poor margins make them riskier, as they are less able to maintain environmental and labour standards. More positively from a policy perspective, it also makes them more easily influenced by government, should it choose to adapt current incentives.
Reviewing food systems will also mean shifting the balance of power away from supermarkets. Tesco, Sainsbury’s and Asda control 56% of the market alone, while the top six control over 80% of the market. As a result, research finds supermarkets and food market intermediaries take the majority of the money we pay for food (Sustain, 2022), with farmers and growers taking very little. This means that farmers carry a lot of the risk and work in difficult conditions for little reward. It can also mean that farm labourers are squeezed into poverty (McAndrew et al, 2023; Jaccarini, 2023). Pioneering social enterprises show us that it need not be this way (Jaccarini et al, 2020), with some paying farmers whatever they deem to be a fair price. Still, for the systemic changes needed, government will have to act.
Expanding land access and the commons
The government has been focused on an incentive-led approach to land use. There are limits to this. As the National Farming Strategy highlights, 20% of farms are highly profitable and so less easily influenced by direct payments (National Food Strategy, 2021: p 31). Land ownership is also very concentrated, meaning enacting change is reliant on a small group of wealthy landowners complying.
Land ownership data is difficult to gather, as accessing official information on plot boundaries or ownership costs £3 per file. This means purchasing information on the 26 million titles (In addition, Land Registry data is incomplete, as it only has titles for properties that have been bought or sold, meaning it has registers of 88% of the UK’s land) (HM Land Registry, 2023) listed on The Land Register would cost £156 million in total to obtain. Still, researchers estimate that 1% of the population owns half of the land in England (Shrubsole, G. 2019b). The aristocracy and landed gentry own around 30% of England, whilst the country’s homeowners own just 5% of the land. The public sector, meanwhile, owns around 8% of England. In Scotland, land ownership is even more concentrated, with just 500 people owning half of the land (McKenna, 2013). By extension, the concentrated ownership of land also means that our current and potential natural carbon sinks are held by a concentrated few. Indeed, researcher Guy Shrubsole estimates that around 1,000 landowners own a third of England’s woods (also c.1 million acres) (Shrubsole, G. 2020b).
A similar situation exists with England’s national parks. Unlike in the US, where the land in national parks is owned by the federal government, the land in England’s national parks is overwhelmingly owned by private landowners. For example, an estimated 95% of the Yorkshire Dales is in private ownership, as is 90% of the Norfolk Broads (Shrubsole, G. 2019a).
The government has mandated local government to produce Local Nature Recovery Strategies (Defra, 2023) to enable nature recovery. In the case of West Berkshire, where 30 landowners own half of the county (Shrubsole, G. 2017), the council will essentially need to rely on the willingness of the county’s 30 largest landowners to take part in nature recovery efforts. Similar dynamics will play out across the country.
To challenge this, a more ambitious approach than incentives and voluntary recovery plans will likely be needed. Private property rights in England grant landowners a ‘bundle of rights’, including the right to the produce of the land (e.g., from farming), the right to exclude others (the law of civil trespass), the right to lease it out and charge rents, and even the right to destroy or waste the land (Sprankling, 2014). The 1947 Town and Country Planning Act essentially altered these rights so that landowners no longer had an absolute right to build on land without first obtaining the permission of the local planning authority. This Act explicitly excluded farming and forestry from the planning system.
One way of approaching this would be via a systemic reform that incorporates this land back into a planned system so that its use can be appropriately planned, commonly known as a Land Use Framework. Such an approach is widely recognised as an important part of the solution (The Food, Farming & Countryside Commission, 2023). Any transition towards this will need to be gradual, with farmers adequately compensated.
Expanding green spaces and nature restoration policy recommendations
Institutions for delivery:
- UK government should put in place a national Land Use Framework that amends property rights, such that landowners must comply with agreed uses for agricultural and rural land. This use should be determined in a transparent, open, inclusive, and evidence-led way. Local government should be empowered to lead the development of local land use plans, to support the realisation of national missions.
- UK government should explore establishing a Bank of England (BoE)-funded land bank to support landowners struggling to make changes to their land. This would be analogous to the proposal that was put forward by researchers at UCL and C4EJ (Purves & Ryan-Collins, 2020). Under this proposal, the BoE would offer to buy the freehold of properties from landlords who are struggling to adapt their land use. The BoE would then grant landlords a long-term lease, for example, for 100 years. Under this lease, the landlord could use the land as agreed within the Land Use Framework, in return for paying an annual rent to the BoE on the land value. The scheme would be entirely optional. This would likely see the least productive, most carbon-rich farmland move into public ownership.
- Reform UK food systems to empower growers to better take care of their land. This should include reforming the power of supermarkets by introducing tougher regulation, such as legally binding sectoral supply chain codes of practice, building better routes to market for farmers and increasing transparency in supply chains. This should build on the recommendations made by the National Food Strategy and Sustain, amongst others.
- Make the Land Register free to access so that reliable information on land ownership can be analysed by all. This should be used by national bodies such as the Forestry Commission and Natural England, and local government, to support local land use planning.
Powers:
- Empower local government to use the new Land Use Framework to create Local Nature Recovery Strategies, create Local Land Use Plans, and designate areas as part of a Nature Recovery Network.
- Assign new powers to National Park Authorities to drive nature recovery by adopting the recommendations of the Glover Review (Defra, 2019). The government should make nature recovery a statutory purpose of National Park Authorities and make other public bodies obliged to help deliver on this.
Funding:
- Ensure that agricultural subsidies are gradually and fairly transitioned to payments that reward farmers for nature restoration. This should include payments for agroforestry, in addition to the existing schemes for afforestation. A timeline of changes should be laid out for the transition so that farmers can plan ahead.
Policy summary
The full list of Local Green New Deal policy recommendations are summarised in Table 6.
| Ambition | Policy | |
|---|---|---|
| Cheaper bills, warmer, zero carbon homes | Institutions | 10-year Local Retrofit Delivery Framework supporting regions to set up a Retrofit Taskforce and local one-stop shops with central government expertise and leadership to support implementation. |
| Nationwide citizen engagement campaign, supporting councils and community groups to engage the public on the retrofit challenge. | ||
| £400m for councils to establish new training courses and apprenticeships for retrofit tradespeople. | ||
| Powers | Most retrofit and fuel poverty delivery is devolved to local and combined authorities. | |
| Reintroduce Minimum Energy Efficiency Standards (MEES) and strengthen enforcement powers. | ||
| Funding | Amend legislation to allow for the introduction of Property-Linked Finance so that the UK can learn from the experience of the US and fully leverage private investment. | |
| Central government devolves £2bn to the Local Retrofit Delivery Framework | ||
| Central government devolves £48.5bn low-income fabric grants, with £9bn available for a heat pump boiler scrappage programme, and £4.5bn ringfenced for low-income households. | ||
| Affordable, sustainable public transport | Institutions | Establish central advisory bodies with expertise on bus and rapid transit. |
| Review the functional geography of transport authorities. | ||
| Integrate rail planning with local transport planning. | ||
| Local governments establish wholly owned arm’s length development companies. | ||
| Give automatic control over buses to all transport authorities. | ||
| Powers | Lift the ban on municipal ownership of bus operators. | |
| Move towards a not-for-profit system of bus services. | ||
| Devolve the powers for setting up a light rail system to local government and establish trailblazer cities for integrated public transport. | ||
| Invest around £37bn nationwide to expand and decarbonise bus services and £7bn in local rail by 2040. | ||
| Funding | Give local areas the ability to tax large local employers for rail infrastructure, following London and the Crossrail example. | |
| Strengthen current mechanisms for capturing land value uplift, and reform the land development process to deliver increased revenues for councils. | ||
| Reform appraisal tools for large capital projects, to better value environmental and social benefits. | ||
| Establish central advisory bodies with expertise on bus and rapid transit. | ||
| Car-free city centres and active travel | Institutions | Central government lays out a clear vision for low-traffic town and city centres. |
| National Highways are required to work with local government to tackle emissions. | ||
| Empower and fund local development corporations to develop transport-led housing. | ||
| Powers | Low-Traffic Neighbourhoods are made less difficult and expensive to implement. | |
| Strengthen local government tools to protect cyclists. | ||
| Funding | Review and reform taxes and charges on roads and parking. | |
| Devolve and pool local authority transport funding to provide longer term certainty. | ||
| Radically reform appraisal tools for large capital projects, to properly capture the benefits of active travel and public transport. | ||
| Expanding green spaces and nature restoration | Institutions | Create a national Land Use Framework that amends property rights, such that landowners must comply with agreed uses for agricultural and rural land. |
| Explore establishing a Bank of England-funded land bank to support landowners struggling to make changes to their land. | ||
| Reform UK food systems to empower farmers to take better care of their land. | ||
| Make the Land Register free to access for all. | ||
| Powers | Empower local government to create Local Nature Recovery and Local Land Use Planning Strategies, and to designate areas as part of a Nature Recovery Network. | |
| Assign new powers to National Park Authorities to drive nature recovery. | ||
| Funding | Shift agricultural subsidies to reward farmers for increasing biodiversity and carbon sequestration. | |
Local Green New Deals and local governance
The recommendations outlined in this report highlight how, with the support of Westminster, local and regional government can deliver a Green New Deal. The scale of action required is such that local government cannot do this on its own; the National Infrastructure Commission identified that £246bn of infrastructure investments are needed in the 2024–2054 period (National Infrastructure Commission, 2023). Local government finances and capacity are currently ill-equipped to deliver investment on this scale.
During Covid, local governments across the country stepped up, delivering vital additional support at pace, despite suffering cuts in core local government funding since 2010. As well as funding cuts, years of centralisation have seen local government systematically disempowered and have led to sales of local public assets to ease financial pressures. Regional capacity, such as regional development agencies, have been abolished and an ad hoc patchwork of initiatives have filled their place. Metro Mayors and Combined Authorities have filled some of the gaps in urban areas and five regional Net Zero Hubs have been set up to accelerate the delivery of local net-zero projects, but there is much more to do to achieve a system that can most efficiently deliver on the required scale, with decisions taken as locally as is meaningfully possible. A comprehensive redrawing of administrative geographies is required so that policy silos can be broken down and decisions can be taken at a level of geography that considers economic activity, identity and existing boundaries.
Given this, it is inappropriate to be specific about the exact way in which Green New Deals should be delivered locally and regionally. For effective delivery, there would certainly need to be much greater collaboration and coordination than there currently is between the different levels of government. Still, it is possible to talk in broader terms about the way in which our recommendations need to be operationalised across the four policy areas.
For cheaper, warmer, zero carbon homes, central government needs to establish a 10-year Retrofit Delivery Framework that regional leaders can deliver on. Executive power and oversight of the one-stop shops should sit regionally, as this allows for economies of scale and standardisation, whilst also focusing limited delivery capacity on neighbourhoods which are most in need. This regional leadership will need to work with social housing landlords, local delivery organisations, further education providers, and community groups to engage citizens and deliver retrofit. Similarly, it will depend on central government and national financial institutions, such as the UK Infrastructure Bank, to finance and choreograph its work, support national communication campaigns, and ensure that standards and enforcement powers are aligned to ambitions.
In the area of affordable, sustainable public transport, a similar logic should be followed. Government must review the functional geography of transport authorities, and oversight for transport needs to be closely integrated with other economic development functions, such as housing development. Regional authorities should be empowered to establish proactive development corporations and be given control over buses, as well as the power to establish, and ability to raise funds for, rapid transit systems. Central government will need to strengthen current mechanisms for capturing land value uplift, reform appraisal tools for large capital projects, and establish central advisory bodies with expertise on bus and rapid transit to work with regional leaders.
Oversight for car-free city centres and active travel will again fall to regional authorities, but local authorities will play a greater role, as the two-tier system means powers are held at a lower level. Central government needs to devolve and pool transport funding to provide long-term certainty, while reforming appraisal tools and taxes and charges on roads and parking. Central government also needs to provide strategic leadership on low-traffic town and city centres, and should require National Highways to work with local government to tackle emissions on the strategic road network.
To expand green spaces and nature restoration, central government should put in place a national Land Use Framework. This would effectively mean going beyond the existing Local Nature Recovery Strategies, which currently require local government to outline the environmental outcomes that they seek to achieve in their region. It would also go beyond funding local government to achieve some of those outcomes, though that would be a positive move. Instead, it would amend property rights such that landowners must use their land in a way that coheres with environmental targets, as detailed in local land use plans. In addition, government should reform UK food systems – moving power away from supermarkets and intermediaries, continue reforms to agricultural subsidies, and make information on land free to access for all.
7. Ensuring economic and social justice in Local Green New Deals
Placing equity and justice concerns at the forefront of Local Green New Deals and associated policies will be central to their broader social acceptability and wider public support. Social inequality is rife across both the North of Tyne and Greater Brighton regions, with pockets of deprivation in both regions posing substantial policy and governance challenges to local leaders and local and combined authorities. Issues of justice, fairness, equity, and public acceptance in energy transitions are central concerns for the UK public at large (Evensen et al, 2018) and the research community (Carley & Konisky, 2020). Therefore, it is wise for policymakers and policy initiatives to consider the public impacts of these policies and how they might benefit the local population in ways that attend to local social inequalities and divisions.
Guiding principles, drawing inspiration from justice principles in energy justice and just transitions research, can help to advance such aims with regards to the policy measures and key objectives outlined in this report (McCauley and Heffron, 2018; Atkins, 2023). If attended to, the four principles below can contribute towards the realisation of economic and social justice in Local Green New Deals:
- Equitable distribution and access to Green New Deal policy programmes (Distributional justice)
- Opportunities for public involvement in Green New Deal policy implementation (Procedural justice)
- Targeted support for low-income households, communities and areas (Recognition justice)
- Supporting community ownership and engagement for local wealth building as part of Local Green New Deals (Economic justice)
Our Local Green New Deal policies connect to these four principles. Area-based home retrofit programmes would go some way in ensuring both distributional and recognition justice are realised in Green New Deals, provided they ensure that homes that are both ‘hard to reach’ and ‘hard to treat’ are prioritised in local energy efficiency policies. Similarly, the Affordable, low-carbon public transport objective could – if combined effectively with the area-based home retrofit programme – address both energy poverty and transport poverty simultaneously (Martiskainen, 2020), whilst achieving distributional and recognition justice aims. Ensuring that the public are involved in key decisions around implementing Car-free city centres and active travel infrastructure will be key to realising procedural justice. This could be through climate assembly and public forum modes, or through more traditional open public consultations by local and combined authorities. Additionally, innovative models for community co-ownership of city-led bike schemes and electric car clubs which reduce overall car ownership, for example, could attempt to address the economic justice aspects of new Local Green New Deal transport programmes.
Moreover, when thinking about Expanding green spaces and nature restoration, the use of innovative community ownership models, such as Community Land Trusts, could ensure that new green spaces and re-wilded biodiversity spots are locked into community ownership, and that local government and community groups work together for sustainable land management. These measures could offer community ownership and engagement to local populations in new Green New Deal policy areas. Finally, the four guiding principles work well with the North of Tyne Combined Authority Inclusive Economy Board’s ‘Wellbeing Framework’ (Thurman et al, 2022) and the various inclusive economy ambitions of the constituent councils of the Greater Brighton Economic Board, as seen in Brighton & Hove’s ‘fair and inclusive’ approach to its 2023–2027 City Council Plan (Brighton & Hove City Council, 2023).
8. Conclusions
In this report, we have outlined how addressing the UK’s pressing climate, social and economic problems demands a strategy and approaches which are locally devised and can be locally delivered. We argue that these ‘Local Green New Deals’ can provide both a holistic framework and a coherent political narrative for achieving this. Focusing on measures which lead to significant reductions in carbon emissions and energy demand, our proposals centre on four policy areas, which we argue should be given increased resources, new powers, and lead to the creation of new institutions for their delivery. These are cheaper, warmer, zero carbon homes; affordable, sustainable public transport; car-free city centres and active travel; and expanding green spaces and nature restoration. We found these measures were popular with citizens in two contrasting regions, Greater Brighton and North of Tyne.
Achieving these objectives will require the broadening and deepening of the UK’s, and especially England’s, devolution agenda. The UK retains one of the most centralised political systems in the Western world. By providing local government with the tools and accountability for delivering Local Green New Deals, national government could usher in a new era of green prosperity and restore the UK’s crumbling public realm, overcoming decades of growing regional inequality, underinvestment, and inaction on climate change. We believe this document provides an important template for how such a programme could be achieved.
References
- Ames, C. 2023. Rail industry in no-man’s land as GBR ‘shelved’Opens in a new tab. London: Transport Network.
- Atkins, E. 2023. A just energy transition: getting decarbonisation right in a time of crisis. Bristol University Press. doi: 10.2307/jj.5186774Opens in a new tab
- Barrett, J., Pye, S., Betts-Davies, S., Eyre, N., Broad, O., Price, J., Norman, J., Anable, J., Bennett, G., Brand, C., Carr-Whitworth, R., Marsden, G., Oreszczyn, T., Giesekam, J., Garvey, A., Ruyssevelt, P. and Scott, K. 2021. The role of energy demand reduction in achieving net-zero in the UKOpens in a new tab. Centre for Research into Energy Demand Solutions. Oxford, UK. ISBN: 978-1-913299-11- 8
- Barrett, J., Pye, S., Betts-Davies, S., Broad, O., Price, J., Eyre, N., Anable, J., Brand, C., Bennett, G., Carr- Whitworth, R., Garvey, A., Giesekam, J., Marsden, G., Norman, J., Oreszczyn, T., Ruyssevelt, P. and Scott, K. 2022. Energy demand reduction options for meeting national zero-emission targets in the United Kingdom. Nature Energy, 7: 726–735. doi: 10.1038/s41560-022-01057-yOpens in a new tab
- Barter, P. 2014. Japan’s proof-of-parking rule has an essential twin policyOpens in a new tab. Singapore: Reinventing Parking.
- BEIS, 2019. UK becomes first major economy to pass net zero emissions lawOpens in a new tab. London: Crown Copyright.
- BEIS, 2020. UK local authority and regional carbon dioxide emissions national statistics: 2005 to 2018Opens in a new tab. London: Crown Copyright.
- Brighton & Hove City Council, 2018. Brighton & Hove Economic Strategy 2018 to 2023Opens in a new tab. Brighton: Brighton & Hove City Council.
- Brighton & Hove City Council, 2021. Carbon Neutral 2030 programmeOpens in a new tab. Brighton: Brighton & Hove City Council.
- Brighton & Hove City Council, 2023. Brighton & Hove City Council plan 2023 to 2027Opens in a new tab. Brighton: Brighton & Hove City Council.
- Brown, D., Brisbois, M-C., Lacey-Barnacle, M., Foxon, T., Copeland, C. and Mininni, G. 2023. The Green New Deal: Historical insights and local prospects in the United Kingdom (UK). Ecological Economics, 205: 107696. doi: 10.1016/j.ecolecon.2022.107696Opens in a new tab
- Buck, M. 2017. Crossrail project: finance, funding and value capture for London’s Elizabeth lineOpens in a new tab. London: Institution of Civil Engineers.
- Built Environment Networking, 2019. Brighton needs its own mass transit – says Council ChiefOpens in a new tab. Leeds: Built Environment Networking Ltd.
- Campaign for Better Transport, 2022. Funding local bus services in England: How to ensure every community gets the bus service it needsOpens in a new tab. London: Campaign for Better Transport.
- Carley, S., & Konisky, D.M. 2020. The justice and equity implications of the clean energy transition. Nature Energy, 5(8): 569–577. doi: 10.1038/s41560-020-0641-6Opens in a new tab
- CCC, 2020. Land use: Policies for a net zero UKOpens in a new tab. London: Climate Change Committee. p.8, p.12,
- CCC, 2021. Independent assessment: The UK’s net zero strategyOpens in a new tab. London: Climate Change Commission.
- CCC, 2022. Letter: Reducing energy demand in buildings in response to the energy price crisisOpens in a new tab. London: Climate Change Committee.
- Cheaper Bills, Warmer HomesOpens in a new tab, 2023. UK.
- Cohen, T. 2023. Rishi Sunak scraps government taskforce aimed at saving energy and lowering billsOpens in a new tab. London: Sky News.
- Creutzig, F., Niamir, L., Bai, X., Callaghan, M., Cullen, J., Díaz-José, J. et al. 2022. Demand-side solutions to climate change mitigation consistent with high levels of well-being. Nature Climate Change, 12: 36–46. doi: 10.1038/s41558-021-01219-yOpens in a new tab
- Cuff, M. 2020. Little punishment for landlords flouting energy efficiency rules designed to protect rentersOpens in a new tab. London: The i Newspaper.
- Defra and DfT, 2022. Clean air zone frameworkOpens in a new tab. London: Crown Copyright.
- Defra, 2018. England’s tree health and resilience strategy: Building the resilience of our trees, woods and forests to pests and diseasesOpens in a new tab. London: Crown Copyright.
- Defra, 2019. Landscapes reviewOpens in a new tab. London: Crown Copyright.
- Defra, 2022a. Nature recovery green paper: Protected sites and speciesOpens in a new tab. London: Crown Copyright.
- Defra, 2022b. Woodland cover target: Detailed evidence reportOpens in a new tab. London: Crown Copyright.
- Defra, 2022c. Environment Secretary shares further information on Local Nature Recovery and Landscape Recovery schemesOpens in a new tab. London: Crown Copyright.
- Defra, 2023. Local nature recovery strategiesOpens in a new tab. London: Crown Copyright.
- DfT, 2020. Rail franchising reaches the terminus as a new railway takes shapeOpens in a new tab. London: Crown Copyright.
- DfT, 2021. Low traffic neighbourhoods resident’s surveyOpens in a new tab. London: Crown Copyright.
- DfT, 2022. Transport and environment statistics 2022Opens in a new tab. London: Crown Copyright.
- DfT, 2023a. Travel by vehicle availability, income, ethnic group, household type, mobility status and NS-SECOpens in a new tab. London: Crown Copyright.
- DfT, 2023b. Reported road casualties Great Britain, provisional results: 2022Opens in a new tab. London: Crown Copyright.
- DHLUC, 2022. North East devolution dealOpens in a new tab. London: Crown Copyright.
- Driscoll, J., 2019. Prosperity you can be part of: Manifesto for the North of Tyne MayorOpens in a new tab. Newcastle upon Tyne: North of Tyne Combined Authority.
- End Fuel Poverty Coalition, 2023. About fuel povertyOpens in a new tab. Brighton: Campaign Collective.
- Evensen, D., Demski, C., Becker, S., & Pidgeon, N. 2018. The relationship between justice and acceptance of energy transition costs in the UK. Applied Energy, 222: 451–459. doi: 10.1016/j.apenergy.2018.03.165Opens in a new tab
- Finn, O. and Brockway, P.E. 2023. Much broader than health: Surveying the diverse co-benefits of energy demand reduction in Europe. Energy Research and Social Science, 95: 102890. doi: 10.1016/j.erss.2022.102890Opens in a new tab
- Forest Research, 2022. Forest Research facts & figures 2022: A summary of statistics about woodland & forestry in the UKOpens in a new tab. London: Crown Copyright.
- Forest Research, 2023. Forestry statistics and forestry facts & figuresOpens in a new tab. London: Crown Copyright.
- Gray, M. and Barford, A. 2018. The depths of the cuts: the uneven geography of local government austerity. Cambridge Journal of Regions, Economy and Society, 11
(3): 541–563. doi: 10.1093/cjres/rsy019Opens in a new tab - Green Finance Institute, 2022. Property Linked Finance: rising consumer demand for energy efficiency andOpens in a new tab financial innovationOpens in a new tab. London: Green Finance Institute.
- Gudde, P., Oakes, J., Cochrane, P., Caldwell, N., and Bury, N. 2021. The role of UK local government in delivering on net zero carbon commitments: You’ve declared a Climate Emergency, so what’s the plan? Energy Policy, 154: 112245. doi: 10.1016/j.enpol.2021.112245Opens in a new tab
- HM Land Registry, 2023. About us: We register the ownership of land and property in England and WalesOpens in a new tab. London: Crown Copyright.
- House of Commons, 2022. Road pricing: Fourth report of session 2021–22Opens in a new tab. London: Crown Copyright.
- Innovate UK, 2022. Accelerating net zero delivery: Unlocking the benefits of climate action in UK city-regionsOpens in a new tab. Swindon: Crown Copyright
- ITV News, 2022. The £700m vision that could see the Tyne and Wear Metro extended to WashingtonOpens in a new tab. London: ITV.
- ITV News, 2023. What is a 15-minute city and why is the idea so controversial?Opens in a new tab London: ITV.
- Jaccarini, C. 2023. Migrant agricultural workers face absolute poverty while supermarkets profitOpens in a new tab. London: New Economics Foundation.
- Jaccarini, C., Lupton-Paez, M. and Phagoora, J. 2020. Growing communities: Farmer-focused routes to marketOpens in a new tab. London: NEF Consulting Ltd.
- Jennings, N, Fecht, D. and de Matteis, S. 2019. Co-benefits of climate change mitigation in the UK: What issues are the UK public concerned about and how can action on climate change help to address them?Opens in a new tab Grantham Institute Briefing Paper No. 31.
- Jennings, N., Fecht, D. and De Matteis, S. 2020. Mapping the co-benefits of climate change action to issues of public concern in the UK: a narrative review, The Lancet Planetary Health, 4: e424-e433. doi: 10.1016/s2542-5196(20)30167-4Opens in a new tab
- La Fabrique de la Cité, n.d. The specific case in France: public transportation funded by employers through the versement mobilitéOpens in a new tab. Paris: La Fabrique de la Cité
- Local Partnerships, 2023. Domestic retrofit handbookOpens in a new tab. London: Local Partnerships.
- Lothian Buses, 2019. Lothian annual accountsOpens in a new tab. Edinburgh: Lothian Buses.
- Low emissions Zones Scotland, 2023. How low emissions zones workOpens in a new tab. Glasgow: Low emissions Zones Scotland
- Martiskainen, M., Sovacool, B.K., Lacey-Barnacle, M. Hopkins, D., Jenkins, K.E.H., Simcock, N., Mattioli, G. and Bouzarovski, S. 2020. New dimensions of vulnerability to energy and transport poverty. Joule, 5(1): 3–7. doi: 10.1016/j.joule.2020.11.016Opens in a new tab
- McAndrew, C., Fisher, O., McAllister, C. and Jaccarini,
C. 2023. Debt, migration and exploitation: The seasonal worker visa and the degradation of working conditions in UK horticultureOpens in a new tab. Bridport, Dorset: Landworkers’ Alliance. - McCauley, D. and Heffron, R. 2018. Just transition: Integrating climate, energy and environmental justice. Energy policy, 119: 1–7. doi: 10.1016/j.enpol.2018.04.014Opens in a new tab
- McKenna, K. 2013. Scotland has the most inequitable land ownership in the west. Why?Opens in a new tab London: The Guardian.
- Midgley, H. 2016. Should Brighton get a new tram system?Opens in a new tab Brighton: Brighton Journal.
- Morphet and Clifford, 2017. Local authority direct provision of housingOpens in a new tab. London: Royal Town Planning Institute.
- NAO, 2023. Active travel in EnglandOpens in a new tab. London: National Audit Office.
- National Food Strategy, 2021. The EvidenceOpens in a new tab. London: National Food Strategy.
- National Food Strategy, 2021. The PlanOpens in a new tab. London: National Food Strategy.
- National Infrastructure Commission, 2023. The second national infrastructure assessmentOpens in a new tab. London: National Infrastructure Commission.
- NEA, 2022. What is fuel poverty?Opens in a new tab Newcastle upon Tyne: National Energy Action (NEA).
- New Economics Foundation, 2023. Green New Deal: Cutting carbon emissions, boosting nature and creating good jobsOpens in a new tab. London: New Economics Foundation.
- Nexus Tyne and Wear, 2019. VfM: Economic value of metro and local rail to the North East, Summary paperOpens in a new tab. Newcastle upon Tyne: Nexus Tyne and Wear.
- Nicol, S., Roys, M., David Ormandy, D. and Ezratty, V. 2016. Briefing Paper: The cost of poor housing in the European UnionOpens in a new tab. Watford: BRE.
- North of Tyne Combined Authority, 2021b. North of Tyne Combined Authority creates £18m Green New Deal fundOpens in a new tab Newcastle upon Tyne: North Tyne Combined Authority.
- North of Tyne Combined Authority, 2022a. About the MayorOpens in a new tab. Newcastle upon Tyne: North Tyne Combined Authority.
- North of Tyne Combined Authority, 2022b. Zero carbon, Zero poverty: Our 5-point planOpens in a new tab. Newcastle upon Tyne: North Tyne Combined Authority.
- North Tyne Combined Authority, 2021a. Green New Deal FundOpens in a new tab. Newcastle upon Tyne: North Tyne Combined Authority.
- PBCC, 2022. Place-based Carbon CalculatorOpens in a new tab. Leeds: Centre for Research into Energy Demand Solutions.
- PM’s Office and Defra, 2020. PM commits to protect 30% of UK land in boost for biodiversityOpens in a new tab. London: Crown Copyright.
- Possible, 2023. The truth about low traffic neighbourhoodsOpens in a new tab. London: Possible.
- Purves, A. & Ryan-Collins, J. 2020. A win-win solution to the commercial rent crisisOpens in a new tab. London: UCL Institute for Innovation and Public Purpose.
- Regeneris, 2018. Brighton & Hove Economic Strategy: Evidence BaseOpens in a new tab. Brighton: Brighton & Hove City Council.
- Rodrigues, G. 2022. Raising cash from car-restricting policies: What can London learn from Singapore?Opens in a new tab
London: Centre for Cities. - Senate of the United States, 2018. Resolution: Recognizing the duty of the Federal Government to create a Green New DealOpens in a new tab. Washington D.C.: United States Government.
- Shrubsole, G. 2017. The thirty landowners who own halfa countyOpens in a new tab. UK: Who Owns England?
- Shrubsole, G. 2019a. Are landed interests over-represented on England’s National Park Authorities?Opens in a new tab UK: Who Owns England?
- Shrubsole, G. 2019b. Who owns England? How we lost our land and how to take it back. London: HarperCollins Publishers.
- Shrubsole, G. 2020a. Finding the land to double tree coverOpens in a new tab. London: Friends of the Earth.
- Shrubsole, G. 2020b. Who owns England’s woods?Opens in a new tab UK: Who Owns England?
- Simms, A., Pettifor, A, Lucas, C., Secrett, C, Hines, C., Legget, J., Elliott, L., Murphy, R. and Juniper, T. 2008. A green new deal: Joined-up policies to solve the triple crunch of the credit crisis, climate change and high oil pricesOpens in a new tab. London: New Economics Foundation.
- Sprankling, J.G. 2014. The right to destroy, Chapter 12 in: The International Law of PropertyOpens in a new tab. Oxford: Oxford Academic.
- Stagecoach, 2023. Tackling congestion to unlock the full potential of busesOpens in a new tab. Perth, Scotland: Stagecoach Group Limited.
- Stirling, A., & Mayer, S. 2001. A novel approach to the appraisal of technological risk: a multicriteria mapping study of a genetically modified crop. Environment and Planning C: Government and Policy, 19(4), 529–555. doi: 10.1068/c8sOpens in a new tab
- Sustain, 2022. Unpicking food prices: Where does your food pound go, and why do farmers get so little?Opens in a new tab London: Sustain.
- Sustrans, 2020. What is a low traffic neighbourhood?Opens in a new tab Bristol: Sustrans.
- Szubski, C, 2016. Tokyo: Bicycle Infrastructure. Chapter 3: Bicycle Infrastructure – Tokyo’s Unconventional PathOpens in a new tab. Melbourne: Sportify Cities.
- Terra Sulis Research CIC, 2020. Opportunity mapping woodland in EnglandOpens in a new tab. London: Friends of the Earth.
- TfL, 2023a. Low Emission ZoneOpens in a new tab. London: Transport for London.
- TfL, 2023b. Scrappage schemesOpens in a new tab. London: Transport for London
- The Food, Farming & Countryside Commission, 2023. Land use frameworkOpens in a new tab. Bristol: The Food, Farming & Countryside Commission.
- The Green New Deal Group, n.d. APPG newsOpens in a new tab. London: All-Party Parliamentary Group on the Green New Deal.
- The Guardian, 2017. Why parking your car is too cheap (video)Opens in a new tab. London: The Guardian.
- The Health Foundation, 2021. Health benefits of active travel: preventable early deathsOpens in a new tab. London: The Health Foundation.
- Thurman, B., Turner, B., Ormston, H., Peachey, J., Wallace, J. and Bearne, R. 2022. The North of Tyne Combined Authority Inclusive Economy Board’s Wellbeing framework for the North of TyneOpens in a new tab. Newcastle upon Tyne: North of Tyne Combined Authority.
- Tingey, M. and Webb, J. 2020. Governance institutions and prospects for local energy innovation: laggards and leaders among UK local authorities. Energy Policy, 138: 111211. doi: 10.1016/j.enpol.2019.111211Opens in a new tab
- Transport Nottingham, 2022. Ten years on: Nottingham’s Workplace Parking Levy keeps the city moving aheadOpens in a new tab. Nottingham: Nottingham City Council.
- UK Legislation, 1980. Highways Act 1980Opens in a new tab. London: Crown Copyright.
- UK Legislation, 1992. Transport and Works Act 1992Opens in a new tab. London: Crown Copyright.
- UK Legislation, 1995. The Environment Act 1995Opens in a new tab. London: Crown Copyright.
- UK Legislation, 2004a. Traffic Management Act 20040, Section 16Opens in a new tab. London: Crown Copyright.
- UK Legislation, 2004b. Traffic Management Act 2004, Schedule 8Opens in a new tab. London: Crown Copyright.
- UK Parliament, 2023. Transport Committee calls for sustained financial support for bus services in EnglandOpens in a new tab. London: Crown Copyright.
- UK Tram, 2012. Briefing paper: Costs of light rail schemesOpens in a new tab. Birmingham: UK Tram.
- UK100, 2023. Powers in place: The handbook of local authority net zero powersOpens in a new tab. London: UK100.
- UKGBC, 2021. The retrofit playbookOpens in a new tab. London: UK Green Building Council.
- UKGBC, n.d. Domestic retrofitOpens in a new tab. London: UK Green Building Council.
- UN CTCN, 2011. Road pricingOpens in a new tab. Copenhagen: United Nations Climate Technology Centre & Network.
- UNECE, 2023. Carbon sinks and sequestrationOpens in a new tab. Geneva: United Nations Economic Commission for Europe (UNECE).
- Vaughan, R. 2023. No 10 backtracks on low-traffic neighborhood review saying it is only a ‘fact-finding mission’Opens in a new tab. London: The i Newspaper.
- We Own It, 2023. Buses are better in public handsOpens in a new tab. Oxford: We Own It.
- Wells, I. 2023. Rishi Sunak scraps home energy efficiency taskforceOpens in a new tab. London: BBC.
- Wikipedia Contributors, 2011. Gaia hypothesisOpens in a new tab. Wikipedia.
- Woodland Carbon CodeOpens in a new tab, 2019. Edinburgh: UK Woodland Carbon Code (WCC)
- WWF, 2020. Riskier business: The UK’s overseas land footprintOpens in a new tab. Woking: WWF-UK.
Publication details
Brown, D., Jaccarini, C., Foxon, T., Mininni, G., Copeland, C., Brisbois, M.C., Stack- Maddox, S., Aguirre Martinez, B. and Lacey-Barnacle, M. 2023. Local Green New Deals: A transformative plan for achieving the UK’s climate, social and economic goals locally. Centre for Research into Energy Demand Solutions. Oxford, UK. ISBN: 978-1-913299-19-4
Banner photo credit: Alireza Attari on Unsplash