
Greg Marsden
Executive summary
In 2021 the United Nations Secretary-General issued a ‘Code Red’ warning for humanity, with the risks of exceeding 1.5 degrees of warming perilously close. That year saw the publication of the Department for Transport’s Decarbonisation Plan (TDP) and the UK’s Net Zero Strategy as the UK hosted COP26. Transport is the largest emitting sector of greenhouse gas emissions in the UK and for the first time, projected pathways to zero emissions had been produced. The publication of the Transport Decarbonisation Plan and other key strategies such as Bus Back Better, the Williams-Shapps Review and Gear Change spelt an optimistic picture for a more sustainable, equitable and balanced decarbonisation of the transport sector.
In March 2023, just 21 months after the publication of the Transport Decarbonisation Plan, the revision to the whole of government Net Zero Strategy – the Carbon Budget Delivery Plan (CBDP) – was released. It set out a new carbon reduction pathway for transport. Analysis here reveals that 72 percent of the potential ambition set out in the TDP has been lost in the CBDP. As policies to lock down the transition to electric vehicles have been advanced, demand management has largely been abandoned. This is not gear change, this is reverse gear.
Transport has been the laggard sector in carbon reduction for 30 years. It is now the largest emitting sector. The direction set out in the CBDP to go slower is a continuation of the exceptionalism mindset on transport emission reduction. It may be argued that other parts of the economy can go faster and take up the slack. It is the job of the Climate Change Committee (CCC) to assess those arguments from a carbon perspective across the whole economy. It would, though, be surprising if the paring back of ambition was deemed acceptable given the short time that has passed and the seeming lack of commitment to demand management relative to the CCC’s view of what was possible. Whatever assessment the CCC reaches, from a transport system perspective, the current strategy makes little sense. Pursuing a technology-led strategy, with no adjustment to prices will increase congestion and widen transport inequalities, missing the opportunity to deliver a fairer transition which drives up well- being and productivity.
This report shows that pathways which achieve the Government’s aims on electrification could still be consistent with the CCC’s Balanced Pathway if a 20% reduction in road traffic levels were also to be achieved by 2030 relative to current plans. The policy goal in Scotland is for an absolute reduction in car kilometres of 20% by 2030, although progress against the goal is yet to be substantially realised. Such an outcome cannot be wished for; it needs to be made to come about. In 2021, the Centre for Research into Energy Demand Solutions (CREDS) published a series of scenarios, referred to as Positive Low Energy Futures (PLEF). The PLEF transport report set out alternative pathways which could save energy and carbon but still allow society to flourish (Brand et al., 2021). Pathways with reductions in car mileage will require a step change in funding and delivery of alternatives to car travel which are not currently being planned for. However, every year that passes with a business as usual transport delivery mindset, reduces the potential to shift to such pathways.
Much is being made of the next round of Local Transport Plans (LTPs) as offering additional carbon mitigation through a process of declaring “quantifiable carbon reductions’’. However, there is no indication that there will be anything more than business as usual funding made available. If that is correct, then most of the savings from the LTPs will have already been factored into the baseline conditions and so will not accelerate the mitigation effort. The policy portfolio, as currently constructed, means that government is planning for traffic growth. The ambitions of the CCC for the 6th Carbon Budget for surface transport are, therefore, off the table.
Local, regional and sub-national bodies have declared climate emergencies and set ambitious transport carbon reduction targets. The level of ambition they thought was in scope when setting their targets has gone. Where next? Two options stand out:
- The national position is accepted, local targets are re-interpreted as ‘aspirations’ and the real carbon ambition is pushed back by a few years.
- Local authorities, businesses and citizens insist on a different approach from national government. Significant transport demand reduction is put back on the agenda which enables the delivery of a fairer and faster transition.
The choices taken in the next couple of years will either open up new opportunities to rethink how society gets around or lock us into a more car-dependent future.
In order to write this report, it has been necessary to force the Department for Transport (DfT) to open up the data surrounding the TDP. Only through transparent accounting and careful scrutiny can the shifts in policy position be understood and communicated. It might be tempting for the DfT to push this report to one side as it does not recognise the numbers in it. If the assumptions held by DfT differ from those presented in the report and the data sheets published alongside it then they should be published.
The recent Transport Data Strategy (DfT, 2023) says many of the right things about open data but the principles are not yet routinely put into practice on decarbonisation projections. National and local governments need to be held to account for the actions they propose and the ones they avoid. The atmospheric concentrations of greenhouse gases are only affected by the delivery of policy, not the storylines.
Glossary
- CBDP | Carbon Budget Delivery Plan
- CCC | Climate Change Committee
- DfT | Department for Transport
- DESNZ | Department for Energy Security and Net Zero
- Domestic Transport | Motorised land based transport, domestic shipping and aviation
- EV | Electric Vehicle
- HGV | Heavy Goods Vehicle
- LTP | Local Transport Plan
- NRTP | National Road Traffic Projections
- NZS | Net Zero Strategy
- 6th CB | Sixth Carbon Budget
Surface Transport | Motorised land-based transport (e.g. car, rail, HGV) - TDP | Transport Decarbonisation Plan
- ZEV | Zero Emission Vehicle (at tailpipe)
1. Blurred lines
The Department for Transport (DfT) published its Transport Decarbonisation Plan (TDP) in July 2021 (DfT, 2021). The strategy is the transport sector’s contribution to the whole of government net zero challenge. It is a comprehensive document at over 200 pages in length covering all modes and domestic and international emissions. The presence of a strategy is to be welcomed and, given the near thirty-year period over which it spans, it is not to be expected that every policy will be specified.
At the heart of the document is the pathway which the Department for Transport sets for domestic transport emissions from the UK transport sector. This is shown below in Figure 1, based on Figure 2 (p 45) of the report. On it are two ‘fuzzy’ bands which represent the full set of policy pathway outcomes which the DfT anticipated. The blue baseline is the pathways that could be followed in the absence of further policy interventions and the green with ‘policy on’.
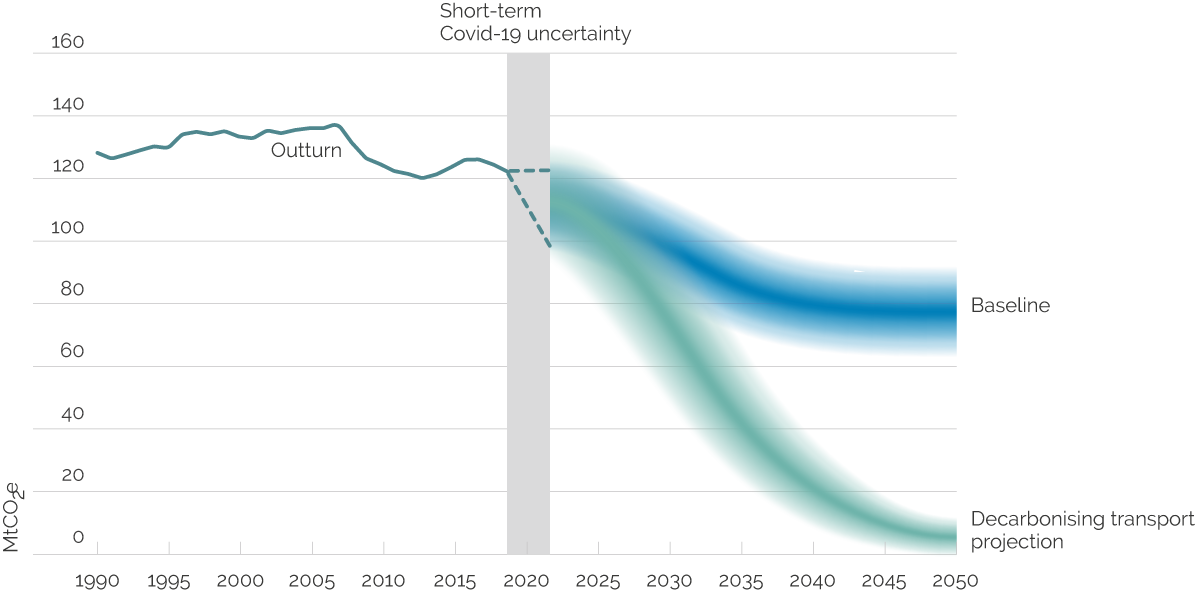
Image description
In 1990 GHG emissions were around 128 MtCO2e annually, rising to a peak in 2007 then falling to120 MtCO2e in 2019. This was followed by an uncertain period during the Covid-19 pandemic (2019 to 2021). The baseline pathways cover a broad band from between 110 and 130 MtCO2e in 2021 falling to between 64 and 83 MtCO2e in 2050. With further policy interventions, the emissions could reduce from between 110 and 130 MtCO2e in 2021 to between zero and 10 MtCO2e in 2050.
Whilst the plan contains various estimates of the extent to which different policy initiatives will contribute to carbon reduction, nowhere in the report was it made clear what the assumptions were that framed the boundaries of the pathway projection.
How then was the professional community to interpret the strategy? How were local authorities to relate their levels of ambition to those in the plan? How much electrification should be assumed and how much traffic growth (or reduction)? I requested this information from the Department for Transport and was, politely, declined.
In March 2022 I submitted a Freedom of Information request which asked for the DfT to release some of the core assumptions around the plan (Full details of my request and the responses can be found on What do they know, 2023.) These were:
- road traffic levels for cars, LGVs and HGVs;
- the proportion of vehicle miles that were assumed to be driven in zero emission modes (electric or green hydrogen); and
- the assumptions which separate out the higher and lower pathways resulting from the Covid-19 uncertainty.
This was declined on the grounds that the DfT needed a ‘safe space’ to discuss policies and that the data might be commercially important. I appealed their decision and, for anyone new to the process like I was, found that this appeal was overseen by the DfT. They upheld their original decision. I was then able to further appeal to the Information Commissioner who ruled in my favour noting that:
“The Commissioner considers that there is a very strong public interest in publication of data that will assist the public in understanding policy decisions – especially those designed to be as far-reaching and long- lasting as the transport decarbonisation strategy. Disclosure will help the public to understand where the Government’s proposals are too ambitious, not ambitious enough or about right.” (ICO, 2022: 3)
The DfT subsequently indicated it would challenge the Information Commissioner’s decision before releasing the information on 12th January 2023 (DfT, 2023a).
This report makes use of the data released and other data subsequently placed in the public domain by the DfT. It is deeply regrettable that it took 10 months for this data to be rightfully placed in the public domain and, indeed, that it was not published in July 2021. Decarbonising transport, as this report shows, is not easy. There will be difficult and potentially unpopular choices ahead. We can only hope to make progress with such decisions if everyone understands the magnitude of the challenge we face. Transparency is central to this. Looking ahead, I hope that this marks a new dawn in open carbon accounting across the sector. I also hope that this report, and the very significant implications of its findings for future carbon policy in the sector, change the debate from one of sugar-coated optimism to one of hard edged realism.
2. Carbon budgets and the TDP pathways
The indicative share of the carbon budget which domestic transport is working towards has been revised twice since the TDP. This marks a significant reduction in the expectations from the sector: 72% of the potential ambition set out in the TDP is now not anticipated to be either feasible or necessary in the Carbon Budget Delivery Plan (DESNZ, 2023).
Figure 2 shows the ambition space of the TDP policy pathway edge cases compared to the Climate Change Committee’s Balanced Pathway. Also included are the trajectories for domestic transport shown in the Net Zero Strategy (NZS) of October 2021. This suggests that the widest range of outcomes set out in the TDP in July 2021 were never really considered likely to be realised. In reality, only pathways which are trending towards the more ambitious pathway for the NZS would be consistent with the expectations set out by the CCC in the 6th Carbon Budget.

Image description
From a starting point of between 122 and 129 MtC for domestic transport in 2018, the pathways diverge and reduce to between 20 and 54 MtC by 2037: CCC 6th CB Balanced Net Zero Pathway 26; DfT TDP Low ambition 54; DfT TDP High ambition 18; NZS Low ambition 34; NZS High ambition 20.
The ‘low ambition’ lines correspond to the upper edge of a set of pathways, with the ‘high ambition’ corresponding to the lower edge.
The Carbon Budget Delivery Plan produced in March 2023 has set out new indicative pathways for each sector. Instead of a range of outcomes in the NZS, single estimates were provided for each budget period which have had to be interpolated. The CBDP budget is superimposed onto the lines from Figure 2 as shown in Figure 3.

Image description
As figure 2 with the addition of the Carbon Budget delivery plan (CBDP). The graph highlights the gap between the CBDP and the DfT TDP high ambition pathway, with the CBDP reducing to 38 MtC and the DfT reaching 18 MtC in 2037.
The estimated carbon gap in ambition between the most and least ambitious lines in the TDP was 567 MtC over the period 2023–2037. The CBDP pathway for domestic transport is a cumulative total of around 411 MtC above the most ambitious pathway in the TDP. This corresponds to a closing off of around 72% of the ambitions set out in the TDP, a document produced less than two years previously. The proposed CBDP pathway is around 180 MtC above the Balanced Pathway set out by the CCC in the 6th Carbon Budget.
The CBDP contains a set of quantified and yet to be quantified estimates of carbon savings from different measures across the whole economy (Table 5 in the CBDP). For surface transport, there are just two measures which correspond to influencing travel demand. The first is enhanced investment in walking and cycling, which is estimated to achieve 0.045 MtC additional mitigation compared to the baseline in 2023–2027, rising to 0.2 MtC in 2033–2037. Increased vehicle occupancy is also included but is not anticipated to provide any savings until 2027 at the earliest, rising to 0.7 MtC during by 2033–2037.
Table 6 in the CBDP also provides some further, as yet unquantified policies, which could contribute to mitigation efforts. These include the quantified carbon reductions which will be declared in the Local Transport Plan process, the publication of the Future of Rural Transport strategy and the launch of the Commute Zero initiative.
The level of quantified carbon mitigation from surface transport demand management is, therefore, just over 8 MtC for the period 2023 to 2037 compared with the 211 MtC estimated by the CCC. Demand management seems to have disappeared from the decarbonisation agenda. Whilst it might be argued that the next round of Local Transport Plans (LTPs) could fill the gap, this has not been estimated (in contrast to a whole raft of technological interventions). Local authority action is important but there needs to be clarity on the extent to which any funding committed will bring additional mitigation. Business as usual funding allocations are already built into the baseline progress. There is no clarity about what extra resource will be made available for the Plans or indeed, that the resources provided will even provide a continuation of spending power in real terms given current inflationary pressures. Public transport also continues to see lower demand than in the pre-pandemic period, particularly Monday to Friday (DfT, 2023b). Unless there is a step change in funding and the adoption of more ambitious plans, then it seems unlikely that the LTP process will contribute significantly to the overall national mitigation effort beyond the baseline. This is not just an issue which is defined by national government. However, any switch away from the private car cannot simply be desired, it has to be brought about. That would require a very different set of policies and funding commitments than is in play today.
Transport is the largest emitting sector in the economy. It has been the slowest sector to decarbonise. This reduction in ambition places greater demands on other sectors, each of which has its own delivery challenges. It could, in theory, be argued that it is economically optimal to pursue a pathway where transport goes slower than other sectors if it is cheaper to save carbon elsewhere in the economy. As the analysis in this document will show however, there is nothing economically optimal about the pathway being adopted within transport. It will also create substantial social injustice along the way given the marginalisation of travel demand policies relative to technology. The next sections unpack these issues further.
3. Estimating emissions
There are lots of numbers produced by lots of government departments spread across multiple documents. The task of reading across them and filling the gaps of ‘what is not said’ is a challenge which makes scrutiny very difficult. The basis for the analysis which follows is set out below for transparency.
For the remainder of this report, the analysis focuses on surface transport emissions. The contribution of domestic aviation and domestic shipping are removed from the analysis as the interventions to tackle these are largely distinct to those which address surface transport.
The analysis in this report have had to be developed through a reverse engineered model (Carbon Scenario Estimator – CaSE) to enable an approximation of the DFT’s carbon estimations. The model is a simple spreadsheet tool which produces estimates of the total national CO2 emissions from the three main components which define carbon from surface transport:
- traffic levels by cars, vans and HGVs
- the proportion of those miles driven in zero emission mode
- the efficiency of the fossil fuel vehicles which drive the remaining miles
The model is calibrated through adjustments to the vehicle efficiency of the remaining fossil fuel fleet.
No emissions from electricity generation are taken account of, nor upstream emissions in the construction of vehicles in line with the DfT’s accounting procedures, not because these should be ignored (See Figure 3 in DfT, 2023c which suggests a whole life saving of 75% emissions for a battery electric vehicle over a petrol engine car).
3.1 Model structure
The model structure is shown below. A series of inputs are required to develop a scenario to be tested. These points where scenarios can be varied are marked with an arrow. Inputs are required for each year, specified out to 2037 which corresponds with the end of the 6th Carbon Budget.

Image description
Flow diagram shows the inputs required to develop the model: Miles travelled by car, LGV, HGV (Specifiable input) followed ZEV proportion of miles travelled by car, LGV, HGV (Specifiable input), then Fossil fuel miles travelled by car, LGV, HGV, followed by Efficiency changes to fossil fuel emissions for car, LGV, HGV (Specifiable input) then Estimates of car, LGV, HGV emissions combined with estimates of bus, rail, other (small) emissions (Specifiable input) lead to Total emissions.
3.2 Calibration
The model was calibrated using data published from the National Road Traffic Projections Core Scenario (DfT, 2022).
Electric vehicle (EV) uptake figures were based on the Transport Appraisal Guidance (TAG) November 2022 update (Unit 3.5.6, A1.3). An initial set of vehicle efficiency estimates were used which had been developed through a combination of examining TAG assumptions (Unit 3.3.5, A.3) and narrative and projected outcomes on efficiency mitigation from the CCC in the 6th Carbon Budget. The assumptions can be found in data sheet 1 of the accompanying spreadsheet.
| Result | 2025 | 2030 | 2035 |
|---|---|---|---|
| CaSE (MtC) | 87.5 | 74.6 | 60.6 |
| NRTP (MtC) | 84.9 | 71.6 | 58.6 |
| Difference (MtC) | 2.6 | 3.0 | 2.0 |
| % Difference | +3.1% | +4.1% | +3.4% |
This suggests that the CaSE model had used slightly less ambitious assumptions on vehicle efficiency gains for non EVs than in the DfT projections.
As the assumptions for cars had been set to be slightly less aggressive than the CCC, these were adjusted. As more of the fleet switches to electric over time, then adjustments to efficiency need to feature early in the period to close the gap. Therefore, it was assumed that, by 2025 a 5% increase in efficiency relative to the initial case was assumed, growing to 7% by 2030 and then flatlining (reflecting no further investment in those technologies by manufacturers).
| Result | 2025 | 2030 | 2035 |
|---|---|---|---|
| CaSE (MtC) | 84.7 | 71.5 | 58.2 |
| NRTP (MtC) | 84.9 | 71.6 | 58.6 |
| Difference (MtC) | -0.2 | -0.1 | -0.4 |
| % Difference | -0.2% | -0.1% | -0.6% |
The difference between the CaSE and NRTP were all within 1%, with CaSE marginally underestimating emissions. This was deemed to be a satisfactory calibration. The vehicle efficiency assumptions applied for cars, vans and HGVs over time are shown in Figure 5 and in data sheet 2 of the accompanying spreadsheet.

Image description
Average efficiency assumptions for a non-EV fleet in 2037 compared with 2019: Cars 0.89, HGVS 0.75, and LGVs 0.74.
3.3 Validation
The calibrated model was then tested against two other scenarios from the National Road Traffic Projections (NRTP) as a validation exercise. These were the High Economy Scenario (Table 3) and the Regional Scenario (Table 4). The efficiency data was held constant as was the EV uptake (in line with the scenario descriptors) and the only variation was the road traffic levels
| Result | 2025 | 2030 | 2035 |
|---|---|---|---|
| CaSE (MtC) | 86.7 | 74.0 | 62.0 |
| NRTP (MtC) | 86.2 | 74.1 | 62.1 |
| Difference (MtC) | +0.5 | -0.1 | -0.1 |
| % Difference | +0.6% | -0.1% | -0.2% |
| Result | 2025 | 2030 | 2035 |
|---|---|---|---|
| CaSE (MtC) | 84.8 | 71.5 | 58.3 |
| NRTP (MtC) | 84.9 | 71.6 | 58.7 |
| Difference (MtC) | -0.1 | -0.1 | -0.4 |
| % Difference | -0.1% | -0.1% | -0.6% |
As the validation falls within ±1% across the two validation scenarios for all years assessed, it is assumed that CaSE reproduces the CO2 emissions in line with the National Transport Model approach and can therefore be used to provide indicative estimates of vehicle emissions from alternative scenario combinations.
It is important to note that the calibration and validation was undertaken using data from the NRTP which is for England and Wales only, whereas the surface transport elements of the TDP released under the FOI request are for the whole of the UK. For the purposes of like for like comparison for the remainder of the report therefore, it was necessary to estimate whole UK traffic levels and to project these across different scenario years. Data from Scotland was taken from TRA0106 (DfT, 2022b) and for Northern Ireland from Infrastructure Northern Ireland (Inferred from Department for Infrastructure, 2014 – where 2014 levels taken to be 2022 and then adjusted according to changes applied to England, Wales and Scotland). The growth rates for Scotland and Northern Ireland were assumed to follow those in the NRTP or as set by the CCC. Traffic levels in Northern Ireland and Scotland formed less than 4% and 9% of the UK total respectively in 2020 and so, whilst this assumption is sub-optimal, any variations are likely to have only a limited impact on the outcomes of the carbon estimator.
Over-estimating traffic levels in Scotland by 10% for example would mean around an additional 1% of miles had been included. The estimates of traffic levels for all of the NRTP scenarios, scaled up to UK, are included in the accompanying spreadsheet.
3.4 Limitations
The aim of the CaSE model is to provide a quick strategic read out of the implications of different levels of ambition on traffic growth, electrification or vehicle efficiency.
The model does not, however, have any feedbacks in it. So, for example, if there is a scenario with high electrification there is no feedback to lower motoring costs which would potentially add traffic growth. However, where possible, scenarios which already included such assumptions (e.g. NRTP) were used.
The model also does not contain a detailed stock model of vehicle turnover (Indeed, the sales of new vehicles, fleet size and turnover rates used in national scenarios are, as yet unclear and a clear stock model would be a useful aid to further transparency). So, estimates of total average fleet efficiency which are used, fold together assumptions about the efficiency of new non zero emission cars, changes in biofuel blends and different scrappage rates which might occur. Plug-in hybrids are treated in two separate ways. Where figures are provided (e.g. in the Freedom of Information request) some of their miles are treated as being driven in electric mode (zero emissions) whilst the remainder count to the fossil fuelled fleet. When they are not provided, estimates can be made to try and replicate the description above or more ambitious improvements to new car efficiency can be assumed. A recent report by the RAC Foundation explores these different issues in more detail (Wengraf and Lam, 2023).
Of course, more model refinement would be desirable. However, the calibration suggests that, as an aggregate tool, it performs well. The model is able to be quickly updated. If numbers are challenged or new numbers come to light as evidence emerges then these can be amended. The key focus here has been transparency.
Whilst the information in the NRTP and the publication of the Common Analytical Scenarios is an important step forward, it is still not standard practice to publish the assumptions on road traffic and technology uptake when Government puts forwards its claims for decarbonisation. The Carbon Budget Delivery Plan, for example, does not clearly set out what assumptions have been used for surface transport.
4. Road traffic levels
The Transport Decarbonisation Plan contained the two edge case road traffic projections which, in July 2021, the DfT suggested framed the carbon ambition within the plan (Figure 6).

Image description
The CCC Balanced pathway shows the number of vehicle miles increasing from 346 billion in 2019 to 386 in 2040. Under the TDP Low ambition pathway, vehicle miles increase to 488 billion in 2040, while under the TDP High ambition pathway, vehicle miles decrease to 326 billion in 2040.
In the TDP high ambition scenario for carbon reductions, road traffic reductions seen during the pandemic are substantially maintained to the degree that even by 2040 road traffic levels are 20bn vehicle miles per year lower than in 2019. This scenario is also assumed to have low GDP and high fuel prices.
By contrast, the low ambition TDP scenario assumes a very different technological future with medium economic growth. Connected autonomous vehicles are more prevalent and people are deemed less likely to share them. Overall road traffic is, by 2040, 142bn vehicle miles higher than 2019.
The black line on the chart represents the assumptions by the CCC in the Balanced Pathway of the 6th carbon budget. This scenario pre-dates the pandemic and assumed that, by 2040, road traffic would be 40 billion vehicle miles per year greater than in 2019.
The analysis shows two important things:
- The within-year gap between the upper and lower traffic scenarios is so large that almost any imaginable traffic future would fall between the two.
- The difference between the scenarios is huge in terms of vehicle miles driven. The TDP high ambition scenario has a cumulative mileage of 4.3 trillion vehicle miles over the period 2023–2037. The equivalent for the CCC was 5.4 trillion vehicle miles and, for the TDP low ambition scenario, 6.3 trillion vehicle miles (47% more than the high ambition scenario).
In December 2022, the DfT published its regular update to the National Road Traffic Projections. A range of scenarios were presented as shown in Figure 7, again scaled up to the whole of the UK.

Image description
Building on figure 6, only two pathways show a reduction in vehicle miles – TDP high ambition and behaviour change. TDP Low Ambition 488; High Economy 451; Core 418; Low Economy 397; CCC Balanced Total 386; Behaviour Change 342; and TDP High Ambition 328.
There is only one scenario which represents a future with no traffic growth, referred to as the behaviour change scenario. This includes major post-pandemic travel behaviour adaptations and accelerations of previous trends such as the shift away from taking up car licenses amongst younger people. The trips made per head of population reduce by 39% for the commute and up to 55% for visiting friends and family by 2040 (DfT, 2022). This scenario seems very unlikely to emerge without any supporting policies to make it happen.
Current traffic levels are already significantly above the levels anticipated in the behaviour change scenario projection which, coupled with the DfT’s own assessment that Covid-19 is likely to be a one-off adjustment to travel behaviour (a 5% reduction in car traffic), suggests that this scenario is only for sensitivity testing plans against, rather than something the DfT is currently basing its policy planning around. Indeed, the Draft National Policy Statement for National Networks states that “continued absolute traffic growth is likely under all scenarios” (DfT, 2023b, p21).
Less than 18 months on from the publication of the Transport Decarbonisation Plan much of the potential ambition on travel demand reduction has been set aside. The core scenario and the variants around it fall above the CCC’s 6th carbon budget pathway. It should be noted that the DfT identifies these scenarios as ‘policy off’ and, therefore, actions could be taken which would impact on the projected road traffic levels. However, as the analysis of the March 2023 CBDP in Section 2 showed, no such policies are currently anticipated out to 2037. The Draft National Policy Statement states that as absolute traffic growth is likely “enhancements on the national road network will be necessary” (DfT, 2023b, p21). It is therefore the case that the government is planning for traffic outcomes which are consistent with the less ambitious half of the TDP.
5. Rate of electrification
The rate at which the fleet of cars, vans and HGVs transition to electric or other equivalent zero tailpipe emission technology makes a significant difference to total carbon emissions. Very aggressive technology uptake curves imply that more of the fleet is zero emission early in the carbon budget periods and, therefore, the impacts of traffic levels are relatively less important than when uptake is slow.
5.1 Transport decarbonisation plan assumptions
Figures 8, 9 and 10 below show the ambitions set out in the FOI response for the more and less ambitious edges of the decarbonisation plan, with the CCC line shown in black for cars, vans and HGVs respectively.

Image description
The current percentage of miles driven in zero emission cars is between 3 and 4%. By 2040, the percentages are anticipated to be: Car EV Share CCC 89%; Car TDP Low Ambition 81%; Car TDP High Ambition 93%.
The uptake pathways, as with the traffic demand pathways, contain substantial variation between the upper and lower bounds. For example, by 2033, in the more ambitious TDP scenario 74% of car miles are electric whereas in the less ambitious scenario this is 47%. Similarly, for vans these figures are 69% and 35% respectively, reflecting the very steep uptake curve on Figure 9. The HGV transition is expected to start later but there is also significant divergence across the scenarios with a difference of 25% in uptake by 2040.

Image description
The current percentage of miles driven in zero emission vans is between 1 and 3% 3%. By 2040, the percentages are anticipated to be: Van EV Share CCC 88%; Van TDP Low Ambition 75%; Car Van High Ambition 92%.

Image description
The current percentage of miles driven in zero emission HGVs 0%. By 2040, the percentages are anticipated to be: HGV EV Share CCC 75%; HGV TDP Low Ambition 49%; HGV TDP High Ambition 76%.
5.2 Zero emission mandate
In March 2023, the final consultation on the implementation of the Zero Emission Mandate was released (DfT, 2023). The Zero Emission Mandate sets out how the UK will, if adopted, transition from the current new car CO2 emission standards to phasing out the sale of entirely fossil fuel engine cars and vans by 2030 and Plug-In Hybrids by 2035. The mandate will be introduced in 2024.
The Mandate essentially sets out the pathway for the introduction of new cars into the fleet. Assumptions about the total size of the fleet, the volume of new vehicle sales and the speed with which fossil fuel vehicles are phased out of the fleet all make a difference to the extent to which new vehicle sales translate to proportions of miles driven in electric vehicles (see Wengraf and Lam, 2023).
The proportions of new car and van sales which should be zero emission, as set out in the consultation, are shown in Table 5. These values are the same as those set out in the first round of consultation and are therefore taken, in this report, to be the likely future policy position.
| Year | Cars | Vans |
|---|---|---|
| 2024 | 22% | 10% |
| 2025 | 28% | 19% |
| 2026 | 33% | 22% |
| 2027 | 38% | 34% |
| 2028 | 52% | 46% |
| 2029 | 66% | 58% |
| 2030 | 80% | 70% |
| 2031* | 84% | 76% |
| 2032* | 88% | 82% |
| 2033* | 92% | 88% |
| 2034* | 96% | 94% |
| 2035* | 100% | 100% |
| *2031 onwards to be set later | ||
Figures 11 and 12 estimate how these new car and van sales proportions would feed through into the proportions of miles driven in electric vehicles. The fleet penetration rates were calibrated against the values set out in Appendix C of the CBDP for cars and vans. It is assumed that EVs are driven like for like the same mileage as their petrol or diesel equivalents. As newer vehicles are used more intensively than older vehicles, so the percent of miles driven fuelled by electricity exceeds the percent of the fleet which is electric.

Image description
In 2019, new car sales were 7% of the total cars sold; EVs accounted for 0.5% of miles driven; Fleet EVs were 0.5% of the total. Under the ZEV mandate in 2037 these figures are estimated to be: new car sales 100%, fleet EVs 63%, with EVs driving 70% of miles.

Image description
In 2019, new van sales were 1% of the total vans sold; EVs accounted for 0.1% of miles driven; Fleet EVs were 0.5% of the total. Under the ZEV mandate in 2037 these figures are estimated to be: new van sales 100%, fleet EVs 55%, with EVs driving 71% of miles.
If we now superimpose the estimated impacts of the zero emission vehicle (ZEV) mandate onto the charts anticipated in the TDP, it is possible to understand how the ambition between the TDP and the proposed policy pathway in the ZEV Mandate relate (Figure 13).

Image description
In 2019, electric cars and vans made up less than 1% of vehicles. In 2037, the difference between the ZEV mandate and the TD pathways is clear: ZEV Mandate Cars 70%; ZEV Mandate vans 71%; Car TDP Low Ambition 69%; Van TDP Low Ambition 62%; Car TDP High Ambition 87%; Van TDP High Ambition 86%.
The ZEV mandate tracks reasonably close to the lower ambition TDP pathway for cars. For LGVs it is slightly ahead in the early period but trends closer to the lower ambition TDP pathway from around 2030. The net position of the ZEV mandate is for the pace of switch of technology to be around 3 years slower than anticipated in the most ambitious scenario in the TDP.
Arguments could be made about whether to include miles driven by plug-in hybrid vehicles as electric miles. However, the calibration of the model already assumes significant technology improvements to overall non-EV emissions of which an increase in hybridisation is one component. No assumptions have been included about the impacts of battery degradation on potentially reducing the mileage of older EVs later in the period. The impacts of different assumptions are explored in the next section.
The discussion about what should or should not be assumed keeps model builders busy. However, these assumptions should be published as standard by the DfT when scenarios are produced.
It is difficult to estimate the impact of the ZEV mandate on the efficiency of the remaining vehicle fleet. The ZEV mandate is proposing to fix the CO2/mile rating for manufacturers at their fleet average 2021 level for the Worldwide Harmonised Light Vehicle Test Procedure (WLTP) cycle for all non zero emission rated vehicles. The ZEV mandate says that its aim is to drive the uptake of EVs and therefore its baseline proposals is that the frameworks do “not seek to encourage new investment to significantly increase the efficiency of the non-ZEV fleet.
Rather, it seeks to ensure that the fleet does not become less efficient over time.” (DfT, 2023, p42). Alternative scenarios of tightening by 2% a year and reversing the increase in upsizing of vehicles have also been proposed in the consultation (reductions of 2.4% per annum). This results in a hypothetical change in vehicle performance as shown in Table 6. The levels of change anticipated in the ZEV mandate all translate to a lower level of vehicle efficiency in non ZEV vehicles than appears to have been included in recent modelling as shown in Figure 5. However, there will also be improvements in conventional vehicle emissions per mile as a result of increased biofuels.
| Scenario | 2021 | 2024 | 2025 | 2026 | 2027 |
|---|---|---|---|---|---|
| Flat | 150 | 150 | 150 | 150 | 150 |
| Tightening | 150 | 150 | 147 | 144.1 | 141.2 |
| Lightweighting | 150 | 150 | 142 | 140 | 139 |
The final uncertainty surrounds the production of equivalent legislation for heavy duty vehicles, where the technology pathways, particularly for heavier classes, remains more uncertain. The assumptions set out by the CCC in the Balanced Pathway for the 6th CB have been assumed for HGVs unless otherwise stated.
Looking across the different vehicle classes on rates of switch to electric vehicles, it seems that the most ambitious pathways considered in 2021 are now well out of reach. There also remains a considerable risk over the realisation of anticipated improvements to efficiency of the non-electric fleet.
Nonetheless, the shift to electric vehicles is underway and, within a decade, the position will be transformed relative to today. In a decade, perhaps as much as 50% of mileage will be driven in electric vehicles for cars and vans. If achieved, this would represent a major part of the decarbonisation effort over the period.
Whilst positive from a decarbonisation perspective, this is also providing the most significant shift in the relative costs of travelling for several decades. The cost per mile of driving an electric car is currently around 8p per mile whilst for a fossil fuel vehicle it is around 17p per mile (Vanarama, 2023). The Department for Transport’s analysis in the National Road Traffic Projections (DfT, 2022) acknowledges that lower motoring costs will drive up congestion. In the absence of any change to how motorists pay for travel then this will drive up congestion externalities, thus undermining the economic efficiency of the shift. Such a change will also undermine the competitive position of bus and rail for more journeys. Whilst there is talk of changing to the way we pay for travel, the CBDP contains a suite of policies out to 2037 and none of them include changes to pricing. As things stand, the policy pathway will undermine public transport and increase congestion.
Importantly, the pathway will also generate significant unfairness. The more than 50% savings in per mile costs of driving an electric vehicle accrue to those who can afford an EV and, in particular, can charge at home. By 2030 around 66% of all cars under 3 years old will be electric whilst fewer than 10% of cars over 10 years old will be electric. Those who can least afford access to newer vehicles will be paying more than twice as much per mile to drive as those who are better off. The Zero Emission Vehicle Mandate will legislate for this inevitability. The absence of any compensatory mechanisms means that this will be anything but a just transition.
6. Scenario analysis of carbon pathways
As shown in Section 2, it is now policy to plan for delivery of the least ambitious scenario space set out by the Transport Decarbonisation Plan. This is the result of:
- planning for road traffic growth which is towards the higher end of the TDP envelope;
- legislating for rates of electrification which are in the lower half of the TDP range; and
- legislating for zero or low ambition on vehicle efficiency for new fossil-fuel powered vehicles.
This section explores some scenarios to demonstrate how influential different assumptions might be to carbon outcomes. The scenarios modelled (Table 7) are all presented relative to a baseline which contains the following assumptions:
- NRTP Core Traffic
- ZEV mandate electrification
- Calibrated vehicle efficiency (as per Figure 5)
They are also compared to the CCC’s estimation of emissions for cars, vans and HGVs in the Balanced Pathway of the 6th Carbon Budget. An allocation for Bus, Rail and ‘Other’ surface transport emissions (6.4 MtC in 2019 declining to 2 MtC in 2037) is common across each scenario (The assumptions for bus rail and other are set out in the accompanying data sheets).
| Scenario | Traffic | Electrification | Efficiency |
|---|---|---|---|
| Baseline | NRTP Core | ZEV mandate for vans and cars | Calibrated |
| High Traffic 10 | NRTP Core with a 10% growth by 2030 maintained | ZEV mandate for vans and cars | Calibrated |
| High Traffic 20 | NRTP Core with a 20% growth by 2030 maintained | ZEV mandate for vans and cars | Calibrated |
| Low Traffic 10 | NRTP Core with a 10% reduction by 2030 maintained |
ZEV mandate for vans and cars | Calibrated |
| Low Traffic 20 | NRTP Core with a 20% reduction by 2030 maintained |
ZEV mandate for vans and cars | Calibrated |
| Max TDP EV ambition | NRTP Core | TDP FOI high ambition scenario | Calibrated |
| Min TDP EV ambition | NRTP Core | TDP FOI low ambition scenario | Calibrated |
| No new efficiency | NRTP Core | ZEV mandate for vans and cars | Zero efficiency |
| Limited efficiency | NRTP Core | ZEV mandate for vans and cars | 25% of calibrated efficiency |
| Moderate efficiency | NRTP Core | ZEV mandate for vans and cars | 50% of calibrated efficiency |
| Ambitious efficiency | NRTP Core | ZEV mandate for vans and cars | 25% more than calibrated efficiency |
| All On | NRTP Core with a 20% reduction by 2030 maintained |
TDP FOI high ambition scenario | 25% more than calibrated efficiency |
| All Off | NRTP Core with a 20% growth by 2030 maintained | TDP FOI low ambition scenario | Zero efficiency |
The cumulative emissions for all of the scenarios are shown in Figure 14. A breakdown of the performance relative to the 6th Carbon Budget Balanced Pathway for different efficiency, traffic and electrification scenarios is shown in Figures 15 to 17.

Image description
Cumulative emissions from 2019 to 2037 are estimated to be, in MtC: All Off 1854; All On 1213; Ambitious efficiency 1558; Moderate efficiency 1639; Limited efficiency 1666; No new efficiency 1694; Min TDP EV ambition 1593; Max TDP EV ambition 1400; Low Traffic 20, 1380; Low Traffic 10, 1463; High Traffic 20, 1712; High Traffic 10, 1629; Baseline 1585; CCC 6th Budget Balanced 1361.
The Baseline scenario, which reflects core government assumptions on traffic growth and electrification alongside significant efficiency gains in the fossil fuel fleet exceeds the 6th Carbon Budget Balanced pathway by 171 MtC. This can be interpreted as the reduction in carbon ambition since December 2020 for surface transport emissions.

Image description
The cumulative difference in emissions 2019 to 2037 relative to the CCC 6th Carbon Budget balanced pathway for surface transport under different fossil fuel efficiency scenarios, in MtC is: Baseline 170; No new efficiency 273; Limited efficiency 248; Moderate efficiency 222; Ambitious efficiency 145.
The assumptions on the vehicle efficiency for fossil fuelled vehicles are not clearly set out in the TDP and nor are the implications of the proposals in the ZEV mandate. The calibration work suggests quite substantial levels of efficiency improvements were assumed in the TDP but the ZEV mandate will not necessarily ensure those are realised. Figure 15 explores the implications of different efficiency positions. If no overall fleet efficiencies are realised then the 6th Carbon Budget Balanced pathway would be exceeded by 333 MtC. This points to the critical importance of focusing not just on electrification but on the composition and emissions of the total vehicle fleet. Greater clarity is required here on what the DfT is assuming, as this is a major area of delivery risk.

Image description
The cumulative difference in emissions 2019 to 2037 relative to the CCC 6th Carbon Budget balanced pathway for surface transport under different traffic growth scenarios, in MtC is: Baseline 224; High Traffic 10, 268; High Traffic 20, 351; Low Traffic 10, 102; Low Traffic 20, 19.
If we take the calibrated vehicle efficiency improvements as achievable then the only two variables remaining are the traffic levels and degree of electrification. The ZEV Mandate fixes the likely pathway for electric vehicle uptake and, whilst there is some potential variation in assumptions which can be made about the miles travelled in electric vehicles which result, the assumptions from Figure 13 are applied here to enable the impact of different travel demand scenarios to be modelled. In Figure 16, the Baseline assumes the NRTP core traffic levels. Traffic growth of 10% above the NRTP core by 2030 adds 44 MtC over the period, whilst 20% growth adds 127 MtC. The greater that traffic growth is early in the period, when fewer vehicles are electric, the more significant the impact.
By contrast, reducing traffic growth across all vehicle classes by 10% by 2030 and then allowing the absolute year on year growth from NRTP core for 2030–2037 to appear reduces emissions by 122 MtC with a 20% reduction saving 205 MtC. This is one of only two scenarios run which is close to the 6th Carbon Budget Balanced Pathway.
This suggests that, given the technology pathway which has been selected, traffic reduction of 20% relative to current plans is required to stay in line with the 6th Carbon Budget pathway (a 19 MtC overshoot). Pathways based around NRTP Core all mean that the transport sector will significantly exceed the emissions budget anticipated by the CCC.

Image description
The cumulative difference in emissions 2019 to 2037 relative to the CCC 6th Carbon Budget balanced pathway for surface transport under different electrification scenarios, in MtC isBaseline 170; Max TDP EV ambition 39; Min TDP EV ambition 232.
Turning then to the impacts of more (and less) ambitious electrification pathways, we see that even the most ambitious EV pathway suggested by the TDP would not, with NRTP Core traffic growth and significant conventional vehicle efficiency, meet the CCC’s 6th Carbon Budget expectations. Whilst it should not be assumed that the presence of the ZEV Mandate will necessarily lead to the draw through of electric vehicle miles driven in this report, the legislation is fixing down a key variable. Exploring substantially different “what ifs” for other technology uptake scenarios (other than for HGVs) is increasingly a distraction.
Figures 15 to 17 breakdown the different key components of change to the carbon outcomes and control the other two variables. Two scenarios “All On” and “All Off” were created to explore the impacts of greater or lesser ambition across all three elements. Figure 18 shows the way in which those pathways perform over time relative to the surface transport components of the TDP and the 6th Carbon Budget Balanced Pathway.
The ‘All On’ scenario shows that with the TDP maximum ambition EV uptake, 20% lower traffic in 2030 and an enhanced efficiency approach for fossil fuelled vehicles an outcome 148 MtC below the CCC pathway can be obtained. By contrast, ‘All Off’ has growth in traffic, no efficiency gains in the fossil fuel fleet and low TDP electrification uptake.
This results in a growth in anticipated emissions early in the period before the impacts of electrification begin to dominate. This outcome is 493 MtC higher than anticipated by the Balanced Pathway in the 6th Carbon Budget.

Image description
Pathway performance of the scenarios shows the NZS high ambition scenario out performs all of the others in 2037. All scenarios are between 113 and 116 MtC per annum in 2019, falling to: NZSs Low Ambition 26; NZSs High Ambition 12; CCC 6th 23; Baseline 35; All On 17; All Off 58.
Scenarios which include 20% traffic reductions by 2030 relative to current plans can still be compatible with the ambitions set out by the CCC in the 6th carbon budget. Overall traffic levels in 2037 would also need to be lower than pre-pandemic levels. Even these would require significant progress in both electrification and the efficiency of the remaining fossil fuel vehicle fleet.
7. Implications and where next?
Transport has been the laggard sector in carbon reduction for 30 years. Whilst the TDP included some bold and exciting pathways for carbon reduction from surface transport, the analysis in this report suggests that 72% of the ambition has been abandoned or deemed unnecessary.
The Government is planning for ambitious, but slower than originally deemed possible, electrification of cars and vans, with HGV legislation to follow. Quite considerable expectation appears to be loaded onto the improvements to the efficiency of the remaining fossil fuel fleet and this remains a significant risk. There is almost no expectation of measures on mode shift or travel demand management and there is a plan for traffic growth. Together, these outcomes demonstrate why there has been a lowering ambition for the contribution of surface transport to emission reduction goals.
Part of this shift away from travel demand reduction may be attributable to overly optimistic estimates of the potential impacts of the Covid-19 pandemic on future travel behaviour at the time the TDP was written. Whilst the post-pandemic behavioural changes continue to see lower car traffic, little has been done to capitalise on this (Anable et al., 2022). The failure to grasp this opportunity, coupled with a tight fiscal position for the public sector and continued lower patronage and service reductions on public transport seems to have pushed policy away from the potential for traffic reduction back to traffic growth. The analysis in this report is consistent with previous work (Hopkinson et al., 2021) which shows that the only pathways which align with the CCC’s assessment of the necessary contribution from surface transport include a 20% traffic reduction by 2030, as set out in Scotland.
England is currently in a false prospectus on transport and climate change. Many local authorities have set ambitious targets for carbon reduction which are way beyond the national ambition, particularly as the national ambition has been reduced. It is inevitable that there will be a delivery mismatch with, it seems, far less emphasis being placed on behaviour change nationally than has been deemed necessary and desirable locally. The forthcoming round of Local Transport Plans is an opportunity to re-align ambition across scales. But in what direction? Will local authorities accept the downgrading of ambition or demand a different approach from national government?
Worse still could be a failure to recognise the gap between aspirations and policy and drift along with well intentioned but undeliverable promises.
Whether transport can really backtrack on the emissions reduction goals that the CCC estimated as necessary as recently as December 2020 will need to be assessed by the CCC in its 2023 Progress Report to Parliament. For this to be credible, it would seem necessary for other sectors to be ahead of where they had been and for the level of delivery risk in other sectors to be low. There is a danger that sectors that claim to be difficult to decarbonise will seek shelter in, as yet, unrealised technological progress elsewhere in the economy rather than taking the difficult choices that will open up different pathways now.
Figure 19 below shows part of the monitoring framework set out by the CCC in its 2022 Progress Report to Parliament (CCC, 2022). On it are superimposed preliminary RAG assessments of progress based on the data reviewed in this report. Whilst a fuller account will be provided by the CCC in July, it seems essential that the accounting and accountability frameworks we have in place to assess decarbonisation reflect the data and policy commitments adopted. As a result of the data surrounding the FOI and a range of policy commitments set out by DfT in the past year, the state of different flagstones in the pathway is now much clearer.
The assessment in Figure 19 gives an easy visual confirmation of the lack of balance in the current strategy. Planning for the electric transition is essential. However, in the absence of a sufficiently ambitious travel demand management programme and changes to the fiscal system there will be a growth in congestion, an undermining of the position of some public transport services, a widening of social injustice with drivers of newer EVs paying half the per mile cost of motoring of those holding older cars. As well as not meeting the ambitions set out by the CCC, this is not good transport policy.

Image description
Enablers:
- More resource-efficient vehicles (off track) |Average car size, EV battery capacities.
- Public willingness to travel more sustainably (unclear) | Actions towards low-carbon travel, People choosing more sustainable modes.
- Public and business attitudes to ZEVs (on track) | Public perceptions of EVs, Public charging user experience.
- Robust supply of quality ZEVs (on track) | Availability of ZEV models, Used EV sales.
- Charging infrastructure (unclear) | Public charger number + spread, Charger reliability.
- Use of biofuels (on track) | Road transport biofuel usage.
- Competitive low-carbon modes (off track) | Zero-carbon travel infrastructure, Relative mode costs.
- Supportive tax and spending (off track) | Road network status, Relative transport investment.
Enablers feed into required outcomes:
- Rapid uptake of zero-carbon emission vehicles (on track) | Sales on new electric cars and vans, Sales of news ZEV HGVs and buses, Share of ZEVs in the vehicle fleet.
- Conventional vehicle efficiency (unclear, possibly off track) | New vehicle emissions intensities, Vehicle ages.
- Shift to low-carbon modes (off track) | Active travel and public transport use, Travel by mode.
- More efficient use of vehicles (off track) | Car occupancy and sharing, HGV utilisation.
- Reduced demand for carbon-intensive modes of travel (off track) | Growth in road traffic limited to 2% by 2035, Reduction in car usage per person.
- Reduced vehicle emissions intensities (on track) | Fleet average CO2 intensities of vehicles on the road fall by 2035: Cars to 36–47 g/km, Vans to 55–103 g/km, HGVs to 232–246 g/km.
All feed into surface transport emissions reduction by around 75% by 2035 (relative to 2019).
In 2021, CREDS published a series of scenarios, referred to as Positive Low Energy Futures (PLEF). The PLEF transport report set out alternative pathways which could save energy and carbon but still allow society to flourish (Brand et al., 2021). Pathways with reductions in car mileage will require a step change in funding and delivery of alternatives to the car which is not currently being planned for. Every year that passes with business as usual transport delivery reduces the potential to shift to such pathways. If there is not a step change in our approach to behaviour change in the next five-year Local Transport Plan period then it feels as though it will be too late as there will be a firmer lock-in to a more car dependent electric future which itself will undermine the alternatives.
Finally, it is essential that there is greater transparency and sharing of the data and implications of the policy choices being made. The Information Commissioner has been clear, it is in the public interest to have access to that information. Only then can meaningful debate be had about the difficult choices ahead. National and local governments need to be held to account for the actions they propose and the ones they avoid.
References
- Anable, J., Brown, L., Docherty, I. and Marsden, G. 2022. Less is more: Changing travel in a post-pandemic societyOpens in a new tab. Centre for Research into Energy Demand Solutions. Oxford, UK. ISBN: 978-1-913299-15-6
- Brand, C., Anable, J. and Marsden, G. 2021. The role of energy demand reduction in achieving net-zero in the UK: Transport and mobilityOpens in a new tab Centre for Research into Energy Demand Solutions. Oxford, UK.
- CCC, 2020. Sixth Carbon BudgetOpens in a new tab London: Climate Change Committee.
- CCC, 2022. Monitoring Framework: 2. Surface transportOpens in a new tab London: Climate Change Committee. London.
- Department for Infrastructure, 2014. Annual road traffic estimates: Vehicle kilometres travelled in Northern Ireland, 2014Opens in a new tab Belfast: Crown Copyright.
- DESNZ and BEIS, 2022. Net Zero StrategyOpens in a new tab Crown Copyright: London.
- DESNZ, 2023. Carbon Budget Delivery Plan, HC1269Opens in a new tab London: Crown Copyright.
- DfT, 2021. Decarbonising transport: a better, greener BritainOpens in a new tab London: Crown Copyright.
- DfT, 2022. National Road Traffic Projections 2022Opens in a new tab Crown Copyright: London.
- DfT, 2022b. Road traffic statistics (TRA): TRA0106Opens in a new tab Crown Copyright: London.
- DfT, 2023a. Transport decarbonisation planOpens in a new tab London: Crown Copyright.
- DfT, 2023b. Daily domestic transport use by modeOpens in a new tab London: Crown Copyright.
- DfT, 2023c. A zero emission vehicle (ZEV) mandate and CO2 emissions regulation for new cars and vans in the UK: consultation documentOpens in a new tab London: Crown Copyright.
- Hopkinson, L., Anable, J., Cairns, S., Goodman, A., Goodwin, P., Hiblin, B., Kirkbride, A., Newson, C. and Sloman, L. 2021. The last chance saloon: we need to cut car mileage by at least 20%Opens in a new tab Radical Transport Policy Two-Pagers #10. Machynlleth, Wales: Transport for Quality of Life.
- Vanarama, 2023. How much does it cost to charge an electric car?Opens in a new tab Hemel Hempstead: Vanarama.
- Wengraf and Lam, 2023. Is it necessary to reduce car mileage to meet our carbon emission goals?Opens in a new tab London: RAC Foundation.
- What do they know, 2023. Traffic level and electric vehicle assumptions used in decarbonising transport: A better, greener BritainOpens in a new tab London: What do they know.
Publication details
Marsden, G. 2023. Reverse gear: The reality and implications of national transport emission reduction policies. Centre for Research into Energy Demand Solutions. Oxford, UK. ISBN: 978-1-913299-17-0
Banner photo credit: Alireza Attari on Unsplash